racing bikes. Brand Weight Price ($) A 17.8 2,100 B 16.1 6,350 14.9 8,370 15.9 6,200 17.2 4,000 F 13.1 8,600 16.2 6,000 H 17.1 2,680 17.6 3,400 14.1 8,000 ese data provided the estimated regression equation ý = 28,506 - 1,433x. For these data, SSE = 7,009,621.71 and SST = 51,682,800. Use the F test to determine whether the weight for a bike and the price are related at the 0.05 level of significa te the null and alternative hypotheses. O Hoi Bq = 0 H: B, = 0 O Hoi Bo = 0 H: Bo = 0 H: Bo = 0 Hi Bq < 0 d the value of the test statistic. (Round your answer to two decimal places.)
racing bikes. Brand Weight Price ($) A 17.8 2,100 B 16.1 6,350 14.9 8,370 15.9 6,200 17.2 4,000 F 13.1 8,600 16.2 6,000 H 17.1 2,680 17.6 3,400 14.1 8,000 ese data provided the estimated regression equation ý = 28,506 - 1,433x. For these data, SSE = 7,009,621.71 and SST = 51,682,800. Use the F test to determine whether the weight for a bike and the price are related at the 0.05 level of significa te the null and alternative hypotheses. O Hoi Bq = 0 H: B, = 0 O Hoi Bo = 0 H: Bo = 0 H: Bo = 0 Hi Bq < 0 d the value of the test statistic. (Round your answer to two decimal places.)

Chapter4: Linear Functions
Section: Chapter Questions
Problem 41RE: For the following exercises, consider the data in Table 5, which shows the percent of unemployed in...

Related questions
Question
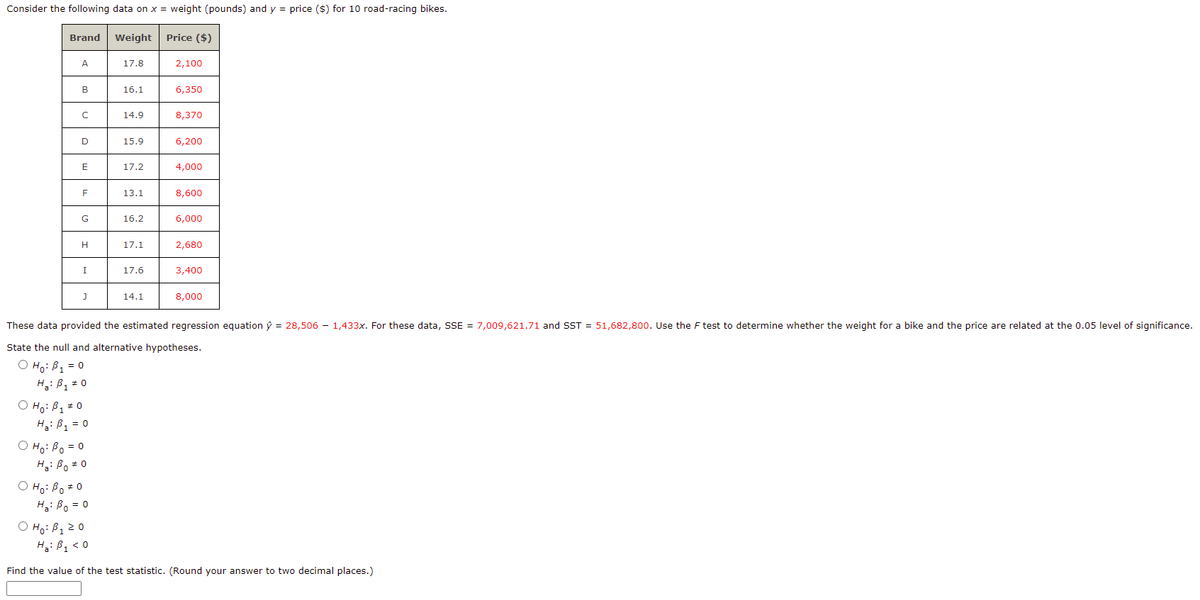
Transcribed Image Text:Consider the following data on x = weight (pounds) and y = price ($) for 10 road-racing bikes.
Brand
Weight
Price ($)
A
17.8
2,100
B
16.1
6,350
14.9
8,370
15.9
6,200
17.2
4,000
F
13.1
8,600
G
16.2
6,000
17.1
2,680
I
17.6
3,400
14.1
8,000
These data provided the estimated regression equation ý = 28,506 - 1,433x. For these data, SSE = 7,009,621.71 and SST = 51,682,800. Use the F test to determine whether the weight for a bike and the price are related at the 0.05 level of significance.
State the null and alternative hypotheses.
O Ho: B, = 0
H3: B1 = 0
O Hoi B1# 0
H3: B1 = 0
O Ho: Bo = 0
H: Bo = 0
O Ho: Bo *0
H: Bo = 0
O Ho: B120
H: B, < 0
Find the value of the test statistic. (Round your answer to two decimal places.)
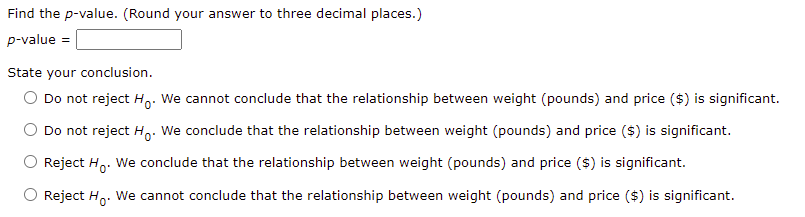
Transcribed Image Text:Find the p-value. (Round your answer to three decimal places.)
p-value =
State your conclusion.
O Do not reject Ho. We cannot conclude that the relationship between weight (pounds) and price ($) is significant.
O Do not reject Ho. We conclude that the relationship between weight (pounds) and price ($) is significant.
O Reject Ho. We conclude that the relationship between weight (pounds) and price ($) is significant.
O Reject Ho. We cannot conclude that the relationship between weight (pounds) and price ($) is significant.
Expert Solution
This question has been solved!
Explore an expertly crafted, step-by-step solution for a thorough understanding of key concepts.

Step by step
Solved in 2 steps with 3 images

Recommended textbooks for you

Functions and Change: A Modeling Approach to Coll…
Algebra
ISBN:
9781337111348
Author:
Bruce Crauder, Benny Evans, Alan Noell
Publisher:
Cengage Learning

Glencoe Algebra 1, Student Edition, 9780079039897…
Algebra
ISBN:
9780079039897
Author:
Carter
Publisher:
McGraw Hill
Functions and Change: A Modeling Approach to Coll…
Algebra
ISBN:
9781337111348
Author:
Bruce Crauder, Benny Evans, Alan Noell
Publisher:
Cengage Learning
Glencoe Algebra 1, Student Edition, 9780079039897…
Algebra
ISBN:
9780079039897
Author:
Carter
Publisher:
McGraw Hill