re of X = 84. Would you prel = = 10? (Hint: he location of

Glencoe Algebra 1, Student Edition, 9780079039897, 0079039898, 2018
18th Edition
ISBN:9780079039897
Author:Carter
Publisher:Carter
Chapter10: Statistics
Section10.3: Measures Of Spread
Problem 26PFA

Related questions
Topic Video
Question
can someone help me with this please ?
Transcribed Image Text:116
CHAPTER 4 MEASURES FOR VARIABILITY
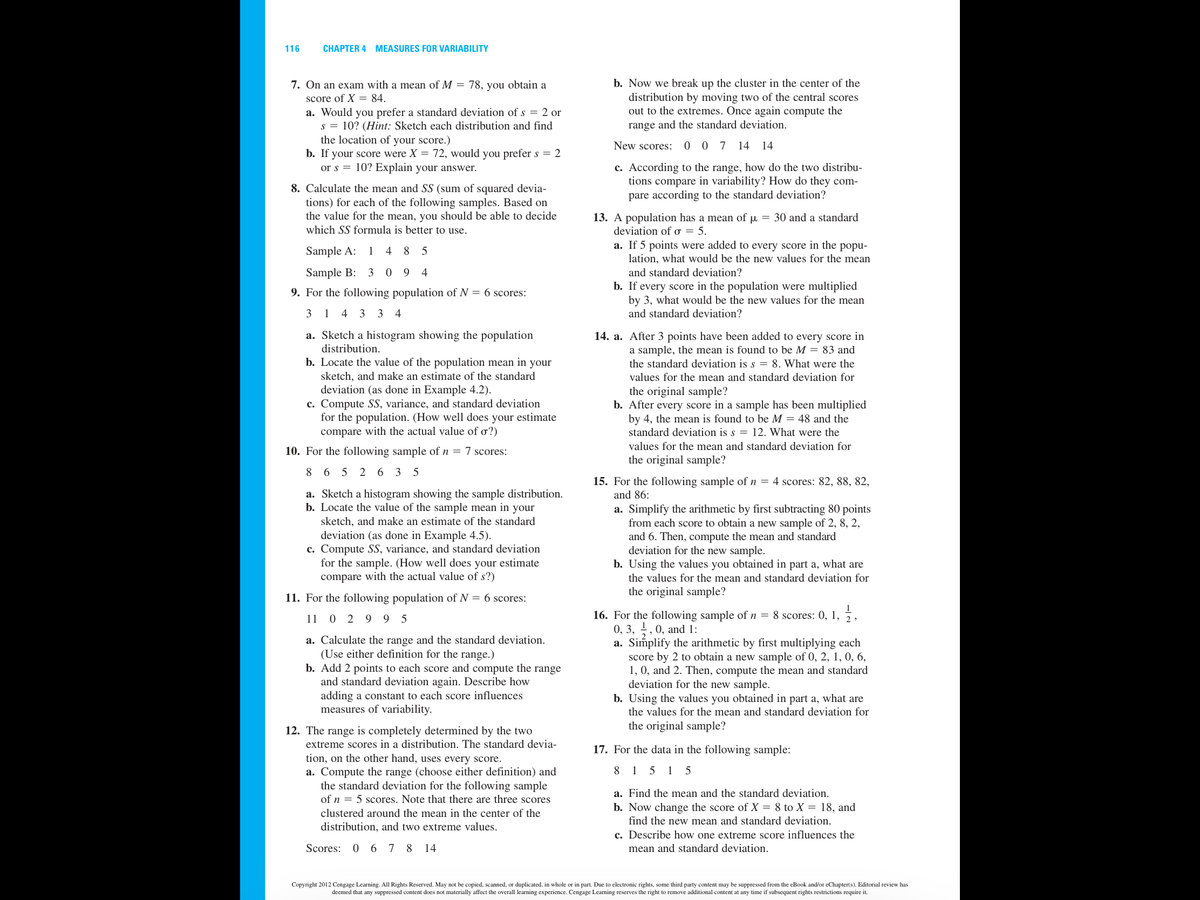
b. Now we break up the cluster in the center of the
7. On an exam with a mean of M = 78, you obtain a
score of X= 84.
a. Would you prefer a standard deviation of s = 2 or
s = 10? (Hint: Sketch each distribution and find
the location of your score.)
distribution by moving two of the central scores
out to the extremes. Once again compute the
range and the standard deviation.
New scores: 0 0 7 14 14
b. If your score were X = 72, would you prefer s = 2
or s = 10? Explain your answer.
c. According to the range, how do the two distribu-
tions compare in variability? How do they com-
pare according to the standard deviation?
8. Calculate the mean and SS (sum of squared devia-
tions) for each of the following samples. Based on
the value for the mean, you should be able to decide
which SS formula is better to use.
13. A population has a mean of µ = 30 and a standard
deviation of o = 5.
a. If 5 points were added to every score in the popu-
lation, what would be the new values for the mean
Sample A:
1
4
8.
5
Sample B: 3 0 9
4
and standard deviation?
b. If every score in the population were multiplied
by 3, what would be the new values for the mean
9. For the following population of N = 6 scores:
3 1 4 3
3 4
and standard deviation?
a. Sketch a histogram showing the population
distribution.
14. a. After 3 points have been added to every score in
a sample, the mean is found to be M = 83 and
b. Locate the value of the population mean in your
the standard deviation is s = 8. What were the
sketch, and make an estimate of the standard
deviation (as done in Example 4.2).
c. Compute SS, variance, and standard deviation
for the population. (How well does your estimate
compare with the actual value of o?)
values for the mean and standard deviation for
the original sample?
b. After every score in a sample has been multiplied
by 4, the mean is found to be M = 48 and the
standard deviation is s = 12. What were the
values for the mean and standard deviation for
10. For the following sample of n = 7 scores:
the original sample?
8 6 5 2 6 3 5
15. For the following sample of n = 4 scores: 82, 88, 82,
and 86:
a. Sketch a histogram showing the sample distribution.
b. Locate the value of the sample mean in your
sketch, and make an estimate of the standard
deviation (as done in Example 4.5).
c. Compute SS, variance, and standard deviation
for the sample. (How well does your estimate
with the actual value of s?)
a. Simplify the arithmetic by first subtracting 80 points
from each score to obtain a new sample of 2, 8, 2,
and 6. Then, compute the mean and standard
deviation for the new sample.
b. Using the values you obtained in part a, what are
compare
the values for the mean and standard deviation for
the original sample?
11. For the following population of N = 6 scores:
16. For the following sample of n = 8 scores: 0, 1, ;,
0, 3, ,0, and 1:
a. Simplify the arithmetic by first multiplying each
score by 2 to obtain a new sample of 0, 2, 1, 0, 6,
1, 0, and 2. Then, compute the mean and standard
deviation for the new sample.
b. Using the values you obtained in part a, what are
11 0 2 9 9 5
a. Calculate the range and the standard deviation.
(Use either definition for the range.)
b. Add 2 points to each score and compute the range
and standard deviation again. Describe how
adding a constant to each score influences
measures of variability.
the values for the mean and standard deviation for
the original sample?
12. The range is completely determined by the two
extreme scores in a distribution. The standard devia-
tion, on the other hand, uses every score.
17. For the data in the following sample:
8 1 5 1 5
a. Compute the range (choose either definition) and
the standard deviation for the following sample
a. Find the mean and the standard deviation.
of n = 5 scores. Note that there are three scores
b. Now change the score of X = 8 to X = 18, and
find the new mean and standard deviation.
clustered around the mean in the center of the
distribution, and two extreme values.
c. Describe how one extreme score influences the
Scores:
0 6 7 8
14
mean and standard deviation.
Copyright 2012 Cengage Learning. All Rights Reserved. May not be copied, scanned, or duplicated, in whole or in part. Due to electronic rights, some third party content may be suppressed from the eBook and/or eChapter(s). Editorial review has
deemed that any suppressed content does not materially affect the overall learning experience. Cengage Learning reserves the right to remove additional content at any time if subsequent rights restrictions require it.
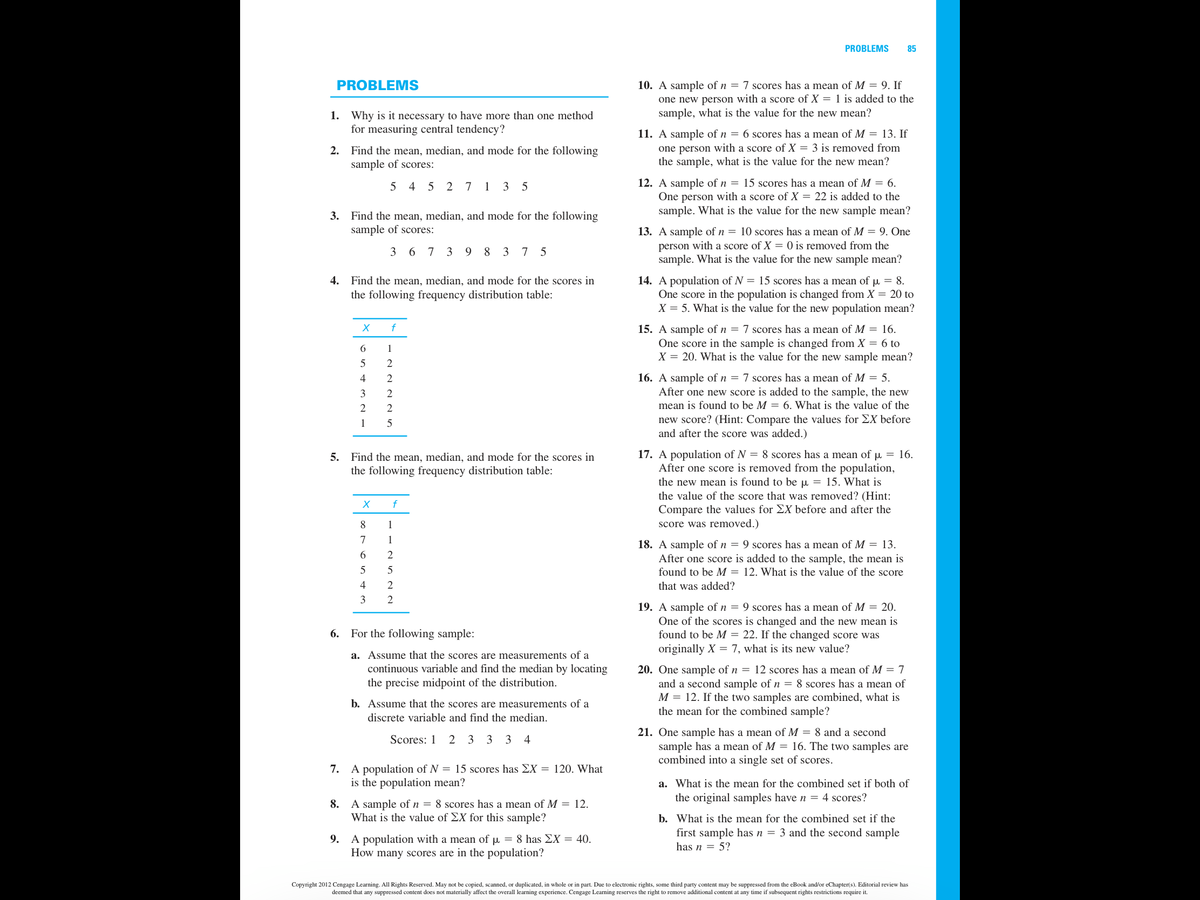
Transcribed Image Text:PROBLEMS
85
PROBLEMS
10. A sample of n = 7 scores has a mean of M = 9. If
one new person with a score of X = 1 is added to the
sample, what is the value for the new mean?
1. Why is it necessary to have more than one method
for measuring central tendency?
11. A sample of n = 6 scores has a mean of M = 13. If
2. Find the mean, median, and mode for the following
sample of scores:
one person with a score of X = 3 is removed from
the sample, what is the value for the new mean?
12. A sample of n = 15 scores has a mean of M = 6.
One person with a score of X = 22 is added to the
sample. What is the value for the new sample mean?
4 5 2 7
1 3
3. Find the mean, median, and mode for the following
sample of scores:
13. A sample of n = 10 scores has a mean of M = 9. One
person with a score of X = 0 is removed from the
sample. What is the value for the new sample mean?
3 6 7 3 9 8 3 7 5
4. Find the mean, median, and mode for the scores in
14. A population of N = 15 scores has a mean of u = 8.
One score in the population is changed from X = 20 to
X = 5. What is the value for the new population mean?
the following frequency distribution table:
f
15. A sample of n = 7 scores has a mean of M = 16.
One score in the sample is changed from X = 6 to
X = 20. What is the value for the new sample mean?
6
1
5
2
16. A sample of n = 7 scores has a mean of M = 5.
After one new score is added to the sample, the new
4
3
2
2
2
mean is found to be M = 6. What is the value of the
new score? (Hint: Compare the values for EX before
and after the score was added.)
1
5
17. A population of N = 8 scores has a mean of p = 16.
After one score is removed from the population,
the new mean is found to be u = 15. What is
the value of the score that was removed? (Hint:
5. Find the mean, median, and mode for the scores in
the following frequency distribution table:
f
Compare the values for EX before and after the
score was removed.)
8
1
7
1
18. A sample of n = 9 scores has a mean of M = 13.
After one score is added to the sample, the mean is
found to be M = 12. What is the value of the score
2
5
4
that was added?
2
19. A sample of n = 9 scores has a mean of M = 20.
One of the scores is changed and the new mean is
found to be M = 22. If the changed score was
6. For the following sample:
originally X = 7, what is its new value?
a. Assume that the scores are measurements of a
continuous variable and find the median by locating
the precise midpoint of the distribution.
20. One sample of n = 12 scores has a mean of M = 7
and a second sample of n = 8 scores has a mean of
M = 12. If the two samples are combined, what is
the mean for the combined sample?
b. Assume that the scores are measurements of a
discrete variable and find the median.
21. One sample has a mean of M = 8 and a second
sample has a mean of M = 16. The two samples are
combined into a single set of scores.
Scores: 1
2 3 3
3 4
7. A population of N = 15 scores has EX = 120. What
is the population mean?
a. What is the mean for the combined set if both of
the original samples have n = 4 scores?
A sample ofn = 8 scores has a mean of M = 12.
What is the value of EX for this sample?
8.
b. What is the mean for the combined set if the
first sample has n = 3 and the second sample
9. A population with a mean of µ = 8 has EX = 40.
How many scores are in the population?
has n = 5?
Copyright 2012 Cengage Learning. All Rights Reserved. May not be copied, scanned, or duplicated, in whole or in part. Due to electronic rights, some third party content may be suppressed from the eBook and/or eChapter(s). Editorial review has
deemed that any suppressed content does not materially affect the overall learning experience. Cengage Learning reserves the right to remove additional content at any time if subsequent rights restrictions require it.
Expert Solution
This question has been solved!
Explore an expertly crafted, step-by-step solution for a thorough understanding of key concepts.

Step by step
Solved in 3 steps

Knowledge Booster


Learn more about
Need a deep-dive on the concept behind this application? Look no further. Learn more about this topic, statistics and related others by exploring similar questions and additional content below.Recommended textbooks for you
Glencoe Algebra 1, Student Edition, 9780079039897…
Algebra
ISBN:
9780079039897
Author:
Carter
Publisher:
McGraw Hill
Glencoe Algebra 1, Student Edition, 9780079039897…
Algebra
ISBN:
9780079039897
Author:
Carter
Publisher:
McGraw Hill