
Case Studies In Health Information Management
3rd Edition
ISBN:9781337676908
Author:SCHNERING
Publisher:SCHNERING
Chapter7: Healthcare Statistics And Research Methods
Section: Chapter Questions
Problem 7.5.2C

Related questions
Question
#7
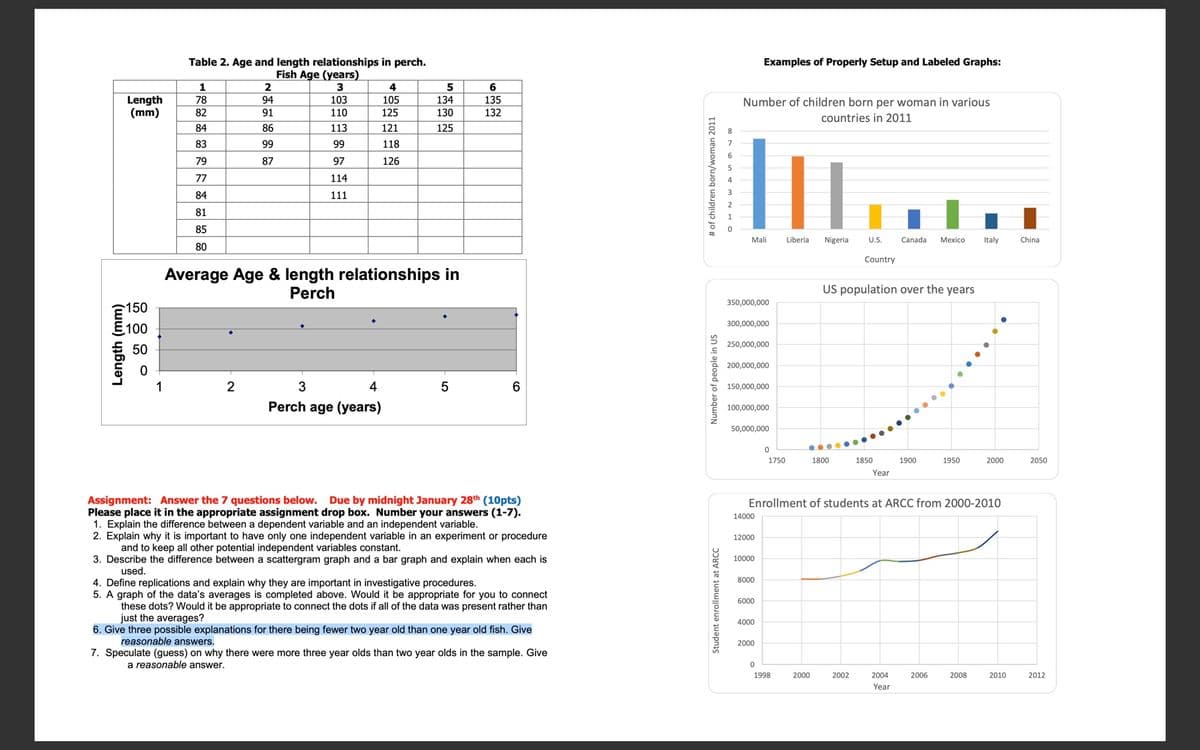
Transcribed Image Text:Table 2. Age and length relationships in perch.
Fish Age (years)
Examples of Properly Setup and Labeled Graphs:
1
2
5
6
Length
(mm)
78
94
103
105
134
135
Number of children born per woman in various
82
91
110
125
130
132
countries in 2011
84
86
113
121
125
83
99
99
118
79
87
97
126
77
114
84
111
81
85
Mali
Liberia
Nigeria
U.S.
Canada
Мexico
Italy
China
80
Country
Average Age & length relationships in
Perch
US population over the years
350,000,000
150
300,000,000
100
250,000,000
50
200,000,000
1
2
4
5
150,000,000
Perch age (years)
100,000,000
50,000,000
1750
1800
1850
1900
1950
2000
2050
Year
Due by midnight January 28th (10pts)
Assignment: Answer the 7 questions below.
Please place it in the appropriate assignment drop box. Number your answers (1-7).
1. Explain the difference between a dependent variable and an independent variable.
2. Explain why it is important to have only one independent variable in an experiment or procedure
and to keep all other potential independent variables constant.
3. Describe the difference between a scattergram graph and a bar graph and explain when each is
used.
Enrollment of students at ARCC from 2000-2010
14000
12000
10000
8000
4. Define replications and explain why they are important in investigative procedures.
5. A graph of the data's averages is completed above. Would it be appropriate for you to connect
these dots? Would it be appropriate to connect the dots if all of the data was present rather than
just the averages?
6. Give three possible explanations for there being fewer two year old than one year old fish. Give
6000
4000
reasonable answers.
2000
7. Speculate (guess) on why there were more three year olds than two year olds in the sample. Give
a reasonable answer.
1998
2000
2002
2004
2006
2008
2010
2012
Year
(ww) y1buə7
Student enrollment at ARCC
Number of people in US
#of children born/woman 2011
Expert Solution
This question has been solved!
Explore an expertly crafted, step-by-step solution for a thorough understanding of key concepts.

This is a popular solution!

Trending now
This is a popular solution!

Step by step
Solved in 3 steps

Knowledge Booster


Learn more about
Need a deep-dive on the concept behind this application? Look no further. Learn more about this topic, biology and related others by exploring similar questions and additional content below.Recommended textbooks for you
Case Studies In Health Information Management
Biology
ISBN:
9781337676908
Author:
SCHNERING
Publisher:
Cengage
Case Studies In Health Information Management
Biology
ISBN:
9781337676908
Author:
SCHNERING
Publisher:
Cengage