Recent Environmental Protection Agency (EPA) fuel economy estimates for automobile models tested predicted a mean of 24.8 mpg and a standard deviation of 6.2 mpg for highway driving. Assume the data is normally distributed. Between which two mpg would you expect 68% of all cars to fall? Between 12.4 mpg and 37.2 mpg Between 18.6 mpg to infinity Between 18.6 mpg and 31 mpg Between 12.4 mpg and 18.6 mpg
Recent Environmental Protection Agency (EPA) fuel economy estimates for automobile models tested predicted a mean of 24.8 mpg and a standard deviation of 6.2 mpg for highway driving. Assume the data is normally distributed. Between which two mpg would you expect 68% of all cars to fall? Between 12.4 mpg and 37.2 mpg Between 18.6 mpg to infinity Between 18.6 mpg and 31 mpg Between 12.4 mpg and 18.6 mpg

Chapter9: Sequences, Probability And Counting Theory
Section9.7: Probability
Problem 1SE: What term is used to express the likelihood of an event occurring? Are there restrictions on its...

Related questions
Question
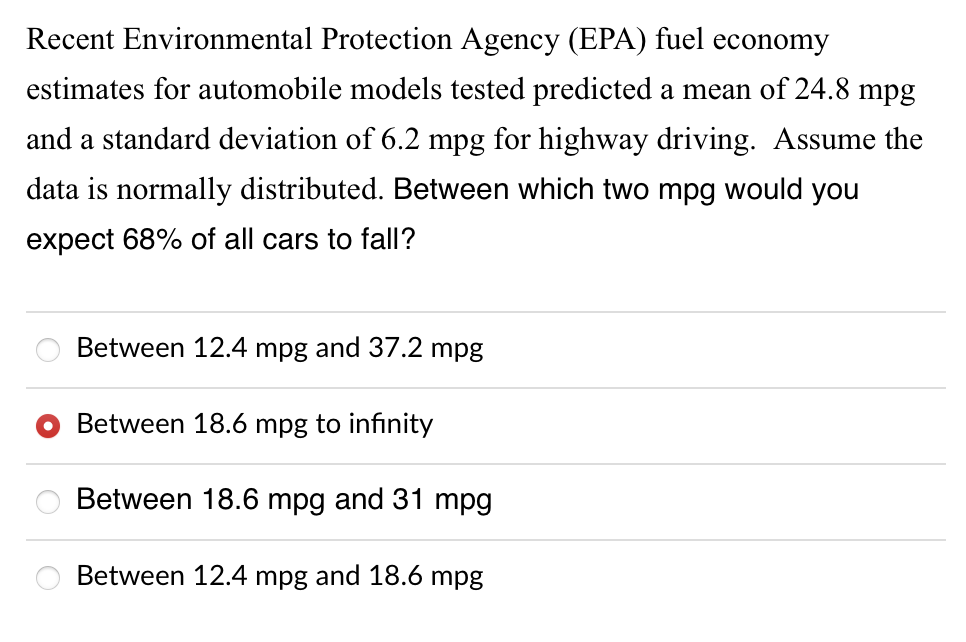
Transcribed Image Text:Recent Environmental Protection Agency (EPA) fuel economy
estimates for automobile models tested predicted a mean of 24.8 mpg
and a standard deviation of 6.2 mpg for highway driving. Assume the
data is normally distributed. Between which two mpg would you
expect 68% of all cars to fall?
Between 12.4 mpg and 37.2 mpg
Between 18.6 mpg to infinity
Between 18.6 mpg and 31 mpg
Between 12.4 mpg and 18.6 mpg
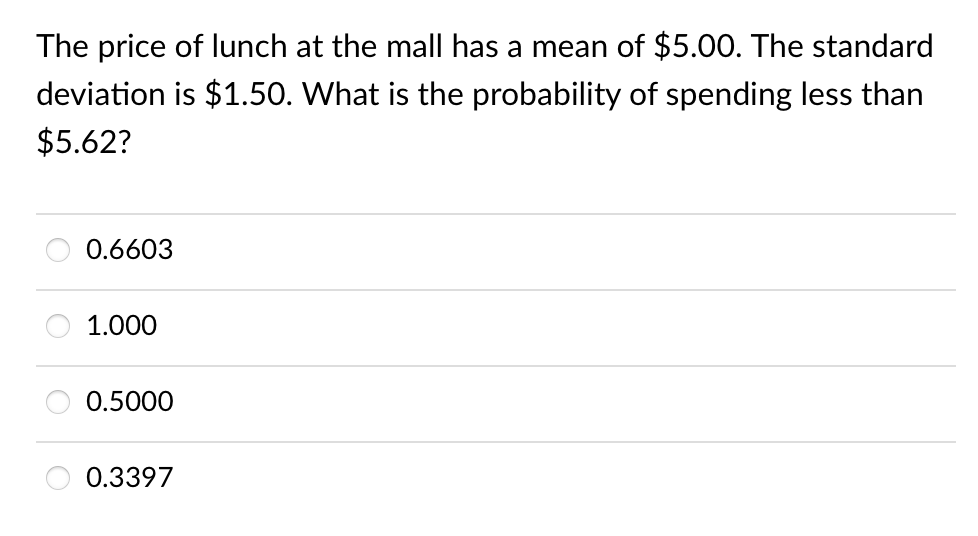
Transcribed Image Text:The price of lunch at the mall has a mean of $5.00. The standard
deviation is $1.50. What is the probability of spending less than
$5.62?
0.6603
1.000
0.5000
0.3397
Expert Solution
This question has been solved!
Explore an expertly crafted, step-by-step solution for a thorough understanding of key concepts.

This is a popular solution!

Trending now
This is a popular solution!

Step by step
Solved in 2 steps

Recommended textbooks for you