Recent research indicates that the effectiveness of antidepressant medication is directly related to the severity of the depression (Khan, Brodhead, Kolts & Brown, 2005). Based on pretreatment depression scores, patients were divided into four groups based on their level of depression. After receiving the antidepressant


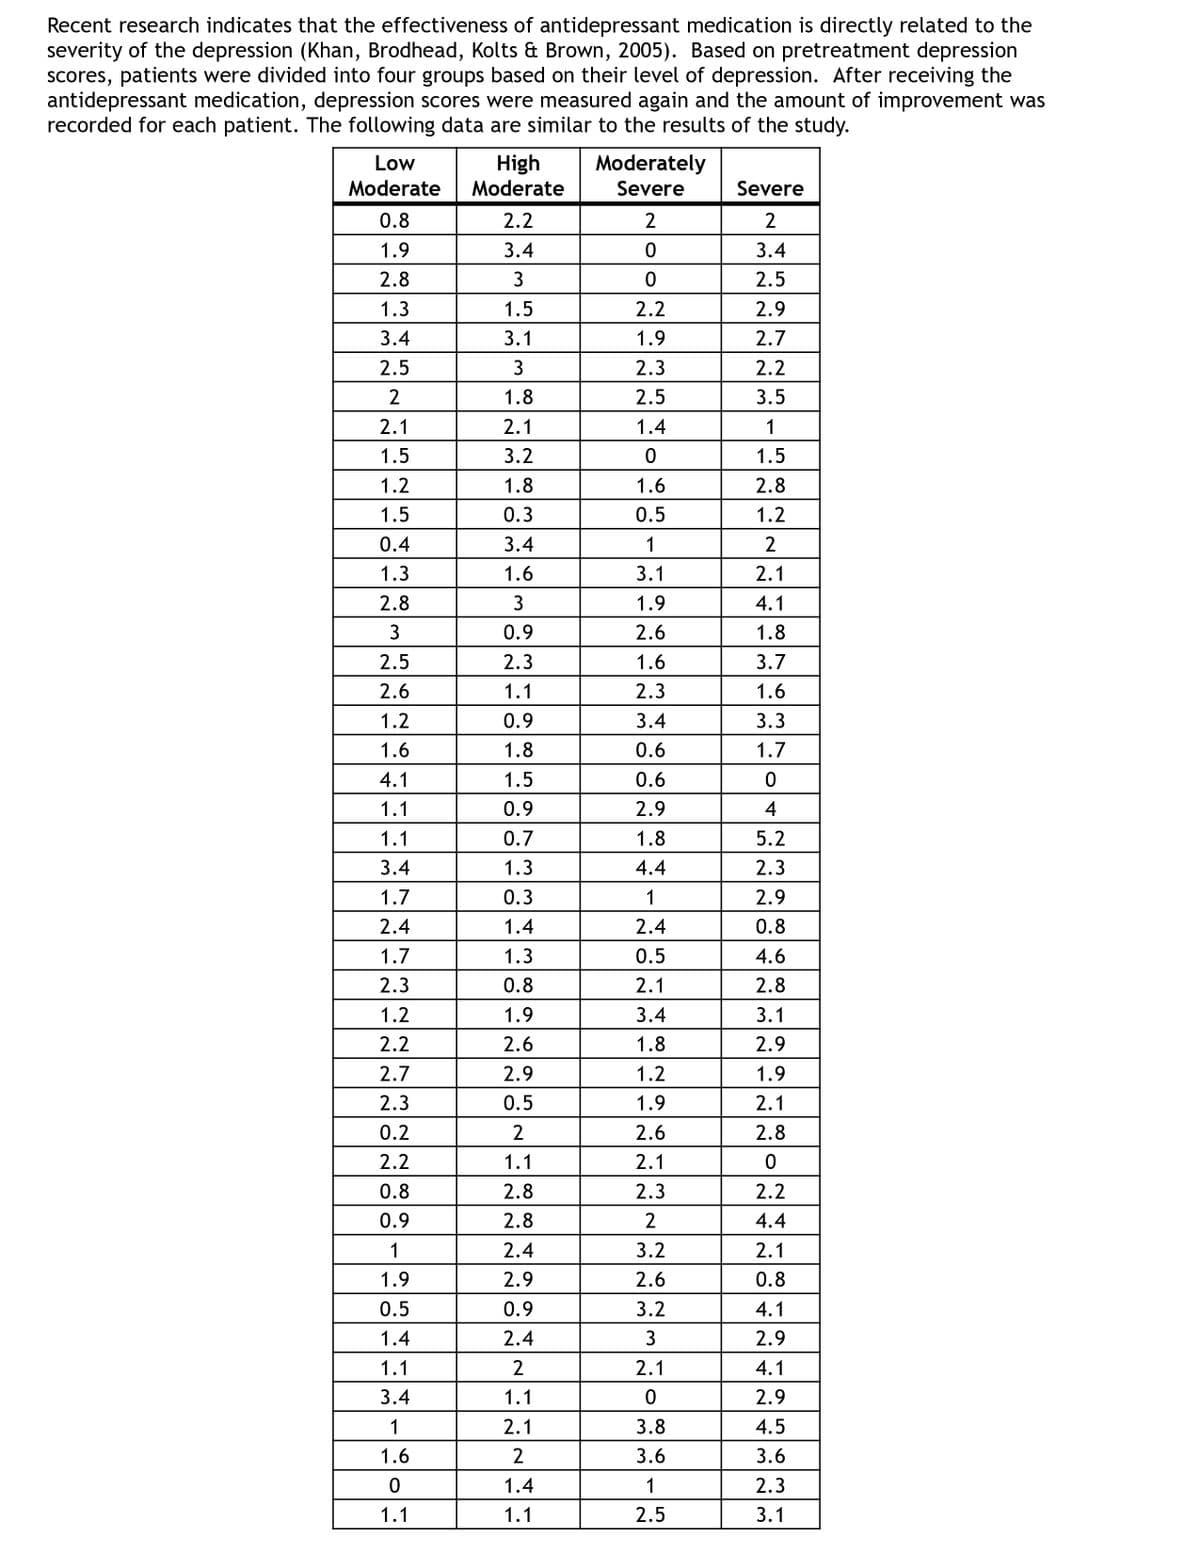
Recent research indicates that the effectiveness of antidepressant medication is directly related to the severity of the depression (Khan, Brodhead, Kolts & Brown, 2005). Based on pretreatment depression scores, patients were divided into four groups based on their level of depression. After receiving the antidepressant medication, depression scores were measured again and the amount of improvement was recorded for each patient. The following data are similar to the results of the study. (see image #1)
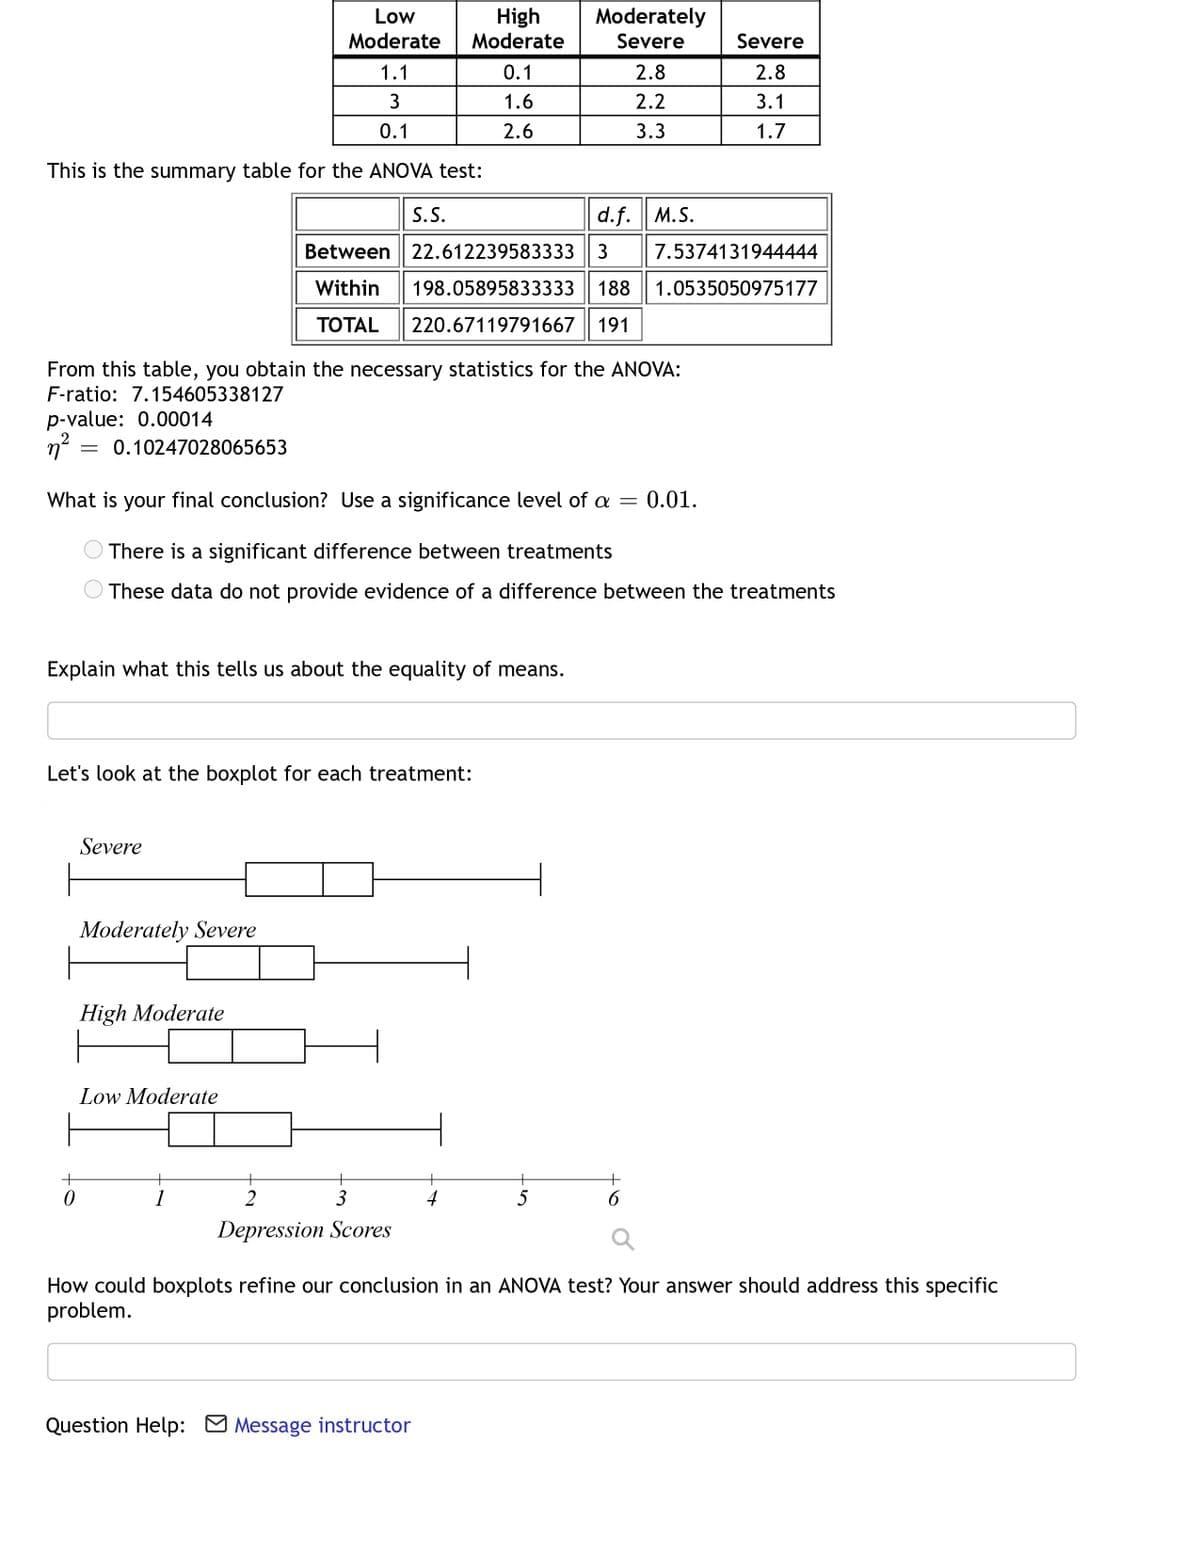
This is the summary table for the ANOVA test:
| S.S. | d.f. | M.S. | |
| Between | 22.612239583333 | 3 | 7.5374131944444 |
|---|---|---|---|
| Within | 198.05895833333 | 188 | 1.0535050975177 |
| TOTAL | 220.67119791667 | 191 |
From this table, you obtain the necessary statistics for the ANOVA:
F-ratio: 7.154605338127
p-value: 0.00014
η2=η2= 0.10247028065653
What is your final conclusion? Use a significance level of α=0.01α=0.01.
- There is a significant difference between treatments
- These data do not provide evidence of a difference between the treatments
Explain what this tells us about the equality of means.
Let's look at the boxplot for each treatment:
Image #2
How could boxplots refine our conclusion in an ANOVA test? Your answer should address this specific problem.


Trending now
This is a popular solution!

Step by step
Solved in 2 steps with 2 images

