Refer to data from the following graphs and explain why crop rotation has been recommended to farmers rather than using fertilizers (L: low Nitrogen level, H: high Nitrogen level). What could be the potential outcome of using synthetic fertilizers in the ecosystem? Fertilizer Effect Crop Rotation Effect 100 100 • Corn Grain Sorghum 80 80 60 60 40 40 20 20 • Corn Grain Sorghum 2007 2008 2009 2010 2011 2012 2013 2007 2008 2009 2010 2011 2012 2013 Figure 2. Yield benefits from added fertilizer (average of L and H) decreased over time, but yield benefits increased over time by rotating crops (average across all 2-yr and 4-yr rötations). % Yield Difference (160 vs 0 lb N/ac) % Yield Difference (Rotated vs Continuous)
Refer to data from the following graphs and explain why crop rotation has been recommended to farmers rather than using fertilizers (L: low Nitrogen level, H: high Nitrogen level). What could be the potential outcome of using synthetic fertilizers in the ecosystem? Fertilizer Effect Crop Rotation Effect 100 100 • Corn Grain Sorghum 80 80 60 60 40 40 20 20 • Corn Grain Sorghum 2007 2008 2009 2010 2011 2012 2013 2007 2008 2009 2010 2011 2012 2013 Figure 2. Yield benefits from added fertilizer (average of L and H) decreased over time, but yield benefits increased over time by rotating crops (average across all 2-yr and 4-yr rötations). % Yield Difference (160 vs 0 lb N/ac) % Yield Difference (Rotated vs Continuous)

Biology: The Dynamic Science (MindTap Course List)
4th Edition
ISBN:9781305389892
Author:Peter J. Russell, Paul E. Hertz, Beverly McMillan
Publisher:Peter J. Russell, Paul E. Hertz, Beverly McMillan
Chapter54: Ecosystems And Global Change
Section: Chapter Questions
Problem 9TYK: The amount of energy available at the highest trophic level in an ecosystem is determined by: a....

Related questions

Question
Transcribed Image Text:8 р
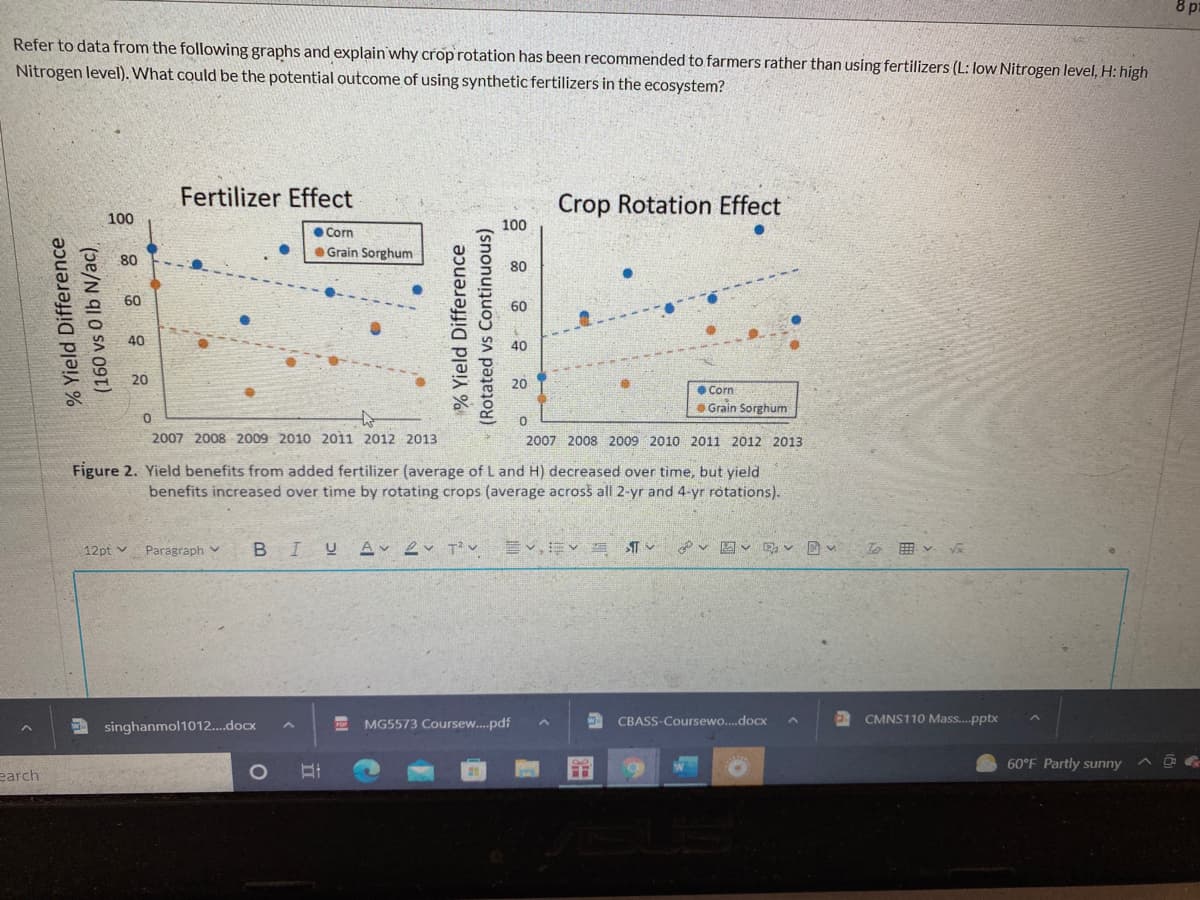
Refer to data from the following graphs and explain why crop rotation has been recommended to farmers rather than using fertilizers (L: low Nitrogen level, H: high
Nitrogen level). What could be the potential outcome of using synthetic fertilizers in the ecosystem?
Fertilizer Effect
Crop Rotation Effect
100
100
• Corn
Grain Sorghum
80
80
60
60
40
20
20
• Corn
Grain Sorghum
2007 2008 2009 2010 2011 2012 2013
2007 2008 2009 2010 2011 2012 2013
Figure 2. Yield benefits from added fertilizer (average of L and H) decreased over time, but yield
benefits increased over time by rotating crops (average across all 2-yr and 4-yr rötations).
12pt v
Paragraph v
B IU Av ev T? v
A singhanmol1012.docx
MG5573 Coursew..pdf
CBASS-Coursewo..docx
CMNS110 Mass.pptx
60°F Partly sunny
earch
% Yield Difference
(160 vs 0 lb N/ac)
% Yield Difference
(Rotated vs Continuous)
Expert Solution
This question has been solved!
Explore an expertly crafted, step-by-step solution for a thorough understanding of key concepts.

Step by step
Solved in 2 steps

Knowledge Booster


Learn more about
Need a deep-dive on the concept behind this application? Look no further. Learn more about this topic, biology and related others by exploring similar questions and additional content below.Recommended textbooks for you
Biology: The Dynamic Science (MindTap Course List)
Biology
ISBN:
9781305389892
Author:
Peter J. Russell, Paul E. Hertz, Beverly McMillan
Publisher:
Cengage Learning

Biology (MindTap Course List)
Biology
ISBN:
9781337392938
Author:
Eldra Solomon, Charles Martin, Diana W. Martin, Linda R. Berg
Publisher:
Cengage Learning

Biology 2e
Biology
ISBN:
9781947172517
Author:
Matthew Douglas, Jung Choi, Mary Ann Clark
Publisher:
OpenStax
Biology: The Dynamic Science (MindTap Course List)
Biology
ISBN:
9781305389892
Author:
Peter J. Russell, Paul E. Hertz, Beverly McMillan
Publisher:
Cengage Learning
Biology (MindTap Course List)
Biology
ISBN:
9781337392938
Author:
Eldra Solomon, Charles Martin, Diana W. Martin, Linda R. Berg
Publisher:
Cengage Learning
Biology 2e
Biology
ISBN:
9781947172517
Author:
Matthew Douglas, Jung Choi, Mary Ann Clark
Publisher:
OpenStax