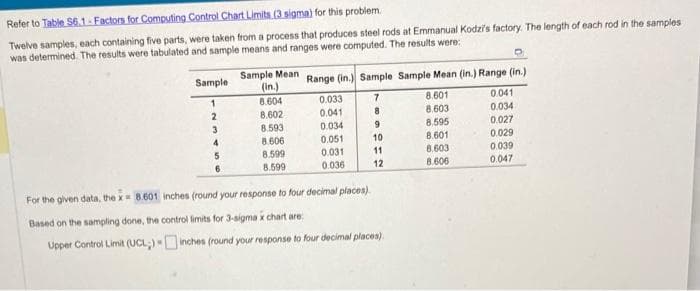
Refer to Table 56.1-Factors for Computing Control Chart Limits (3 sigma) for this problem. Twelve samples, each containing five parts, were taken from a process that produces steel rods at Emmanual Kodzi's factory. The length of each rod in the samples was determined. The results were tabulated and sample means and ranges were computed. The results were: Sample 1 2 3 4 5 Sample Mean (in.) 8.604 8.602 8.593 8.606 8.599 8.599 Range (in.) Sample Sample Mean (in.) Range (in.) 7 8 9 0.033 0.041 0.034 0.051 0.031 0.036 10 11 12 For the given data, the x 8.601 inches (round your response to four decimal places). Based on the sampling done, the control limits for 3-sigma x chart are: Upper Control Limit (UCL;) - inches (round your response to four decimal places). 8.601 8.603 8.595 8.601 8.603 8.606 0.041 0.034 0.027 0.029 0.039 0.047
Refer to Table 56.1-Factors for Computing Control Chart Limits (3 sigma) for this problem. Twelve samples, each containing five parts, were taken from a process that produces steel rods at Emmanual Kodzi's factory. The length of each rod in the samples was determined. The results were tabulated and sample means and ranges were computed. The results were: Sample 1 2 3 4 5 Sample Mean (in.) 8.604 8.602 8.593 8.606 8.599 8.599 Range (in.) Sample Sample Mean (in.) Range (in.) 7 8 9 0.033 0.041 0.034 0.051 0.031 0.036 10 11 12 For the given data, the x 8.601 inches (round your response to four decimal places). Based on the sampling done, the control limits for 3-sigma x chart are: Upper Control Limit (UCL;) - inches (round your response to four decimal places). 8.601 8.603 8.595 8.601 8.603 8.606 0.041 0.034 0.027 0.029 0.039 0.047

Glencoe Algebra 1, Student Edition, 9780079039897, 0079039898, 2018
18th Edition
ISBN:9780079039897
Author:Carter
Publisher:Carter
Chapter10: Statistics
Section10.5: Comparing Sets Of Data
Problem 13PPS

Related questions
Question
Transcribed Image Text:Refer to Table 56.1-Factors for Computing Control Chart Limits (3 sigma) for this problem.
Twelve samples, each containing five parts, were taken from a process that produces steel rods at Emmanual Kodzi's factory. The length of each rod in the samples
was determined. The results were tabulated and sample means and ranges were computed. The results were:
Sample
1
2
3
4
5
Sample Mean
(in.)
8.604
8.602
8.593
8.606
8.599
8.599
Range (in.) Sample Sample Mean (in.) Range (in.)
7
8.601
8
8.603
9
8.595
8.601
8.603
8.606
0.033
0.041
0.034
0.051
0.031
0.036
10
11
12
For the given data, the x 8.601 inches (round your response to four decimal places).
Based on the sampling done, the control limits for 3-sigma x chart are:
Upper Control Limit (UCL;) - inches (round your response to four decimal places).
0.041
0.034
0.027
0.029
0.039
0.047
Expert Solution
This question has been solved!
Explore an expertly crafted, step-by-step solution for a thorough understanding of key concepts.

This is a popular solution!

Trending now
This is a popular solution!

Step by step
Solved in 3 steps with 10 images

Recommended textbooks for you
Glencoe Algebra 1, Student Edition, 9780079039897…
Algebra
ISBN:
9780079039897
Author:
Carter
Publisher:
McGraw Hill
Glencoe Algebra 1, Student Edition, 9780079039897…
Algebra
ISBN:
9780079039897
Author:
Carter
Publisher:
McGraw Hill