Refer to Table S6.1 - Factors for Computing Control Chart Limits (3 sigma) for this problem. Twelve samples, each containing five parts, were taken from a process that produces steel rods at Emmanual Kodzi's factory. The length of each rod in the samples was determined. The results were tabulated and sample means and ranges were computed. The results were: Sample Mean (in.) Range (in.) Sample Sample Sample Mean (in.) Range (in.) 1 9.404 0.044 7 9.403 0.021 2 9.402 0.051 8 9.405 0.058 3 9.393 0.042 9.395 0.039 4 9.404 0.037 10 9.401 0.038 9.399 0.048 11 9.401 0.054 6 9.397 0.053 12 9.404 0.061 For the given data, the x = inches (round your response to four decimal places). Based on the sampling done, the control limits for 3-sigma x chart are: Upper Control Limit (UCL;) = inches (round your response to four decimal places). Lower Control Limit (LCL;) =| inches (round your response to four decimal places).
Refer to Table S6.1 - Factors for Computing Control Chart Limits (3 sigma) for this problem. Twelve samples, each containing five parts, were taken from a process that produces steel rods at Emmanual Kodzi's factory. The length of each rod in the samples was determined. The results were tabulated and sample means and ranges were computed. The results were: Sample Mean (in.) Range (in.) Sample Sample Sample Mean (in.) Range (in.) 1 9.404 0.044 7 9.403 0.021 2 9.402 0.051 8 9.405 0.058 3 9.393 0.042 9.395 0.039 4 9.404 0.037 10 9.401 0.038 9.399 0.048 11 9.401 0.054 6 9.397 0.053 12 9.404 0.061 For the given data, the x = inches (round your response to four decimal places). Based on the sampling done, the control limits for 3-sigma x chart are: Upper Control Limit (UCL;) = inches (round your response to four decimal places). Lower Control Limit (LCL;) =| inches (round your response to four decimal places).

Practical Management Science
6th Edition
ISBN:9781337406659
Author:WINSTON, Wayne L.
Publisher:WINSTON, Wayne L.
Chapter2: Introduction To Spreadsheet Modeling
Section: Chapter Questions
Problem 20P: Julie James is opening a lemonade stand. She believes the fixed cost per week of running the stand...

Related questions
Question
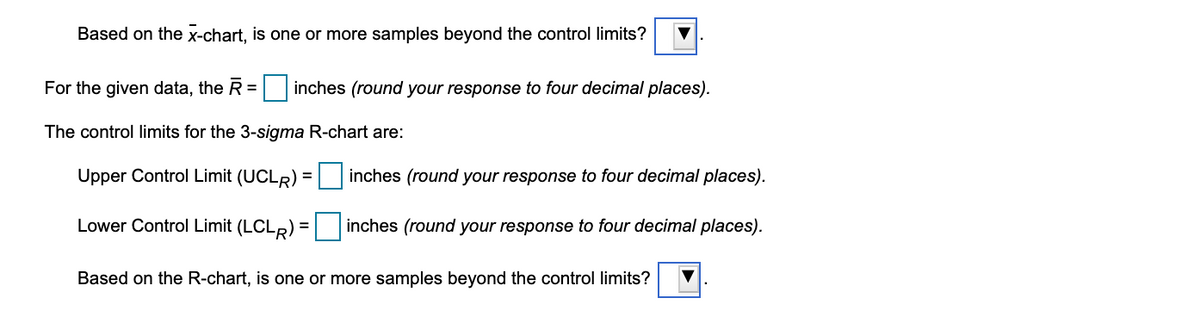
Transcribed Image Text:Based on the x-chart, is one or more samples beyond the control limits?
For the given data, the R = inches (round your response to four decimal places).
%3D
The control limits for the 3-sigma R-chart are:
Upper Control Limit (UCLR) = inches (round your response to four decimal places).
Lower Control Limit (LCLR) = inches (round your response to four decimal places).
Based on the R-chart, is one or more samples beyond the control limits?
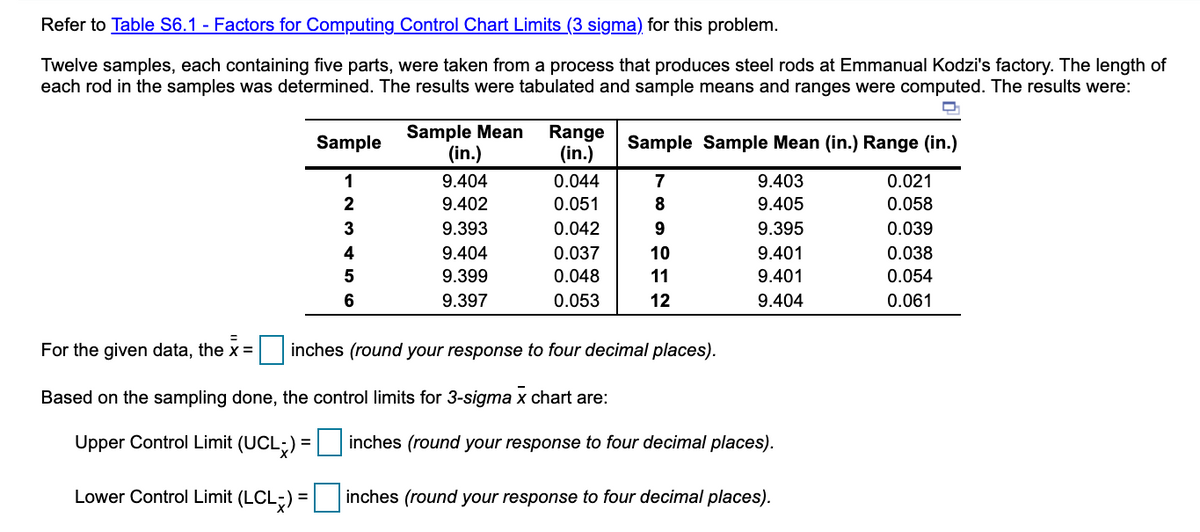
Transcribed Image Text:Refer to Table S6.1 - Factors for Computing Control Chart Limits (3 sigma) for this problem.
Twelve samples, each containing five parts, were taken from a process that produces steel rods at Emmanual Kodzi's factory. The length of
each rod in the samples was determined. The results were tabulated and sample means and ranges were computed. The results were:
Sample Mean
(in.)
Range
(in.)
Sample
Sample Sample Mean (in.) Range (in.)
1
9.404
0.044
7
9.403
0.021
2
9.402
0.051
8
9.405
0.058
3
9.393
0.042
9.395
0.039
4
9.404
0.037
10
9.401
0.038
9.399
0.048
11
9.401
0.054
9.397
0.053
12
9.404
0.061
For the given data, the x =
inches (round your response to four decimal places).
Based on the sampling done, the control limits for 3-sigma x chart are:
Upper Control Limit (UCL;) = inches (round your response to four decimal places).
Lower Control Limit (LCL;) = inches (round your response to four decimal places).
Expert Solution
This question has been solved!
Explore an expertly crafted, step-by-step solution for a thorough understanding of key concepts.

This is a popular solution!

Trending now
This is a popular solution!

Step by step
Solved in 2 steps

Recommended textbooks for you
Practical Management Science
Operations Management
ISBN:
9781337406659
Author:
WINSTON, Wayne L.
Publisher:
Cengage,

Operations Management
Operations Management
ISBN:
9781259667473
Author:
William J Stevenson
Publisher:
McGraw-Hill Education

Operations and Supply Chain Management (Mcgraw-hi…
Operations Management
ISBN:
9781259666100
Author:
F. Robert Jacobs, Richard B Chase
Publisher:
McGraw-Hill Education
Practical Management Science
Operations Management
ISBN:
9781337406659
Author:
WINSTON, Wayne L.
Publisher:
Cengage,
Operations Management
Operations Management
ISBN:
9781259667473
Author:
William J Stevenson
Publisher:
McGraw-Hill Education
Operations and Supply Chain Management (Mcgraw-hi…
Operations Management
ISBN:
9781259666100
Author:
F. Robert Jacobs, Richard B Chase
Publisher:
McGraw-Hill Education


Purchasing and Supply Chain Management
Operations Management
ISBN:
9781285869681
Author:
Robert M. Monczka, Robert B. Handfield, Larry C. Giunipero, James L. Patterson
Publisher:
Cengage Learning

Production and Operations Analysis, Seventh Editi…
Operations Management
ISBN:
9781478623069
Author:
Steven Nahmias, Tava Lennon Olsen
Publisher:
Waveland Press, Inc.