Refer to the accompanying scatterplot. a. Examine the pattern of all 10 points and subjectively determine whether there appears to be a strong correlation between x and y. b. Find the value of the correlation coefficient r and determine whether there is a linear correlation. c. Remove the point with coordinates (1,9) and find the correlation coefficient r and determine whether there is a linear correlation. d. What do you conclude about the possible effect from a single pair of values? Click here to view a table of critical values for the correlation coefficient. a. Do the data points appear to have a strong linear correlation? No Yes b. What is the value of the correlation coefficient for all 10 data points? (Simplify your answer. Round to three decimal places as needed.) r= Table of Critical Values n 4 5 6 7 a = .05 .950 .878 .811 .754 10- a = .01 .990 .959 .917 .875 10 X
Refer to the accompanying scatterplot. a. Examine the pattern of all 10 points and subjectively determine whether there appears to be a strong correlation between x and y. b. Find the value of the correlation coefficient r and determine whether there is a linear correlation. c. Remove the point with coordinates (1,9) and find the correlation coefficient r and determine whether there is a linear correlation. d. What do you conclude about the possible effect from a single pair of values? Click here to view a table of critical values for the correlation coefficient. a. Do the data points appear to have a strong linear correlation? No Yes b. What is the value of the correlation coefficient for all 10 data points? (Simplify your answer. Round to three decimal places as needed.) r= Table of Critical Values n 4 5 6 7 a = .05 .950 .878 .811 .754 10- a = .01 .990 .959 .917 .875 10 X

Glencoe Algebra 1, Student Edition, 9780079039897, 0079039898, 2018
18th Edition
ISBN:9780079039897
Author:Carter
Publisher:Carter
Chapter4: Equations Of Linear Functions
Section4.5: Correlation And Causation
Problem 11PPS

Related questions
Question
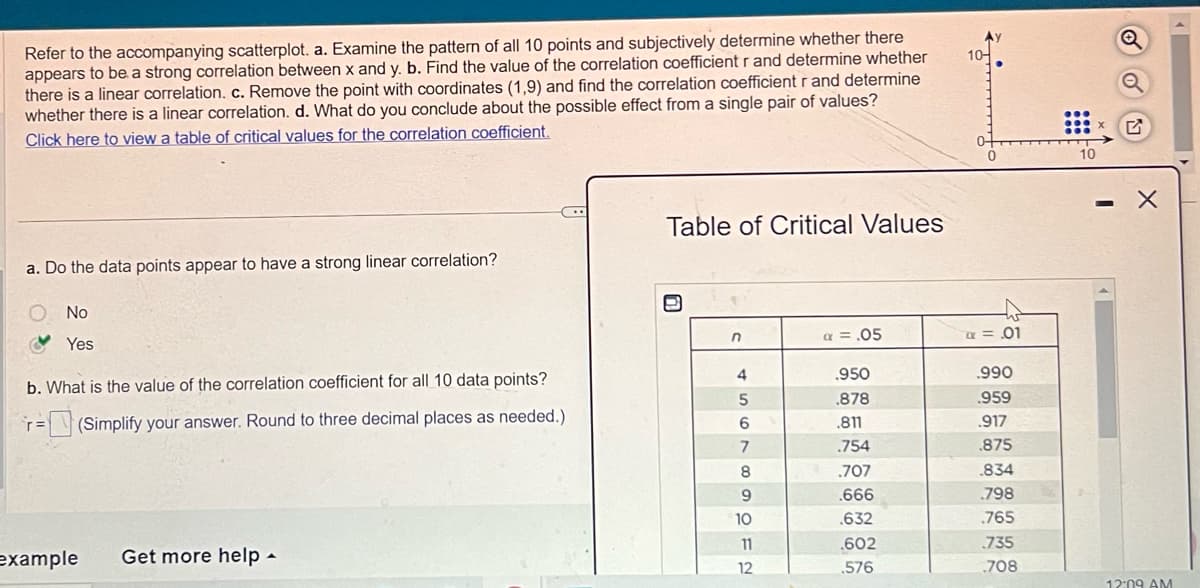
Transcribed Image Text:Refer to the accompanying scatterplot. a. Examine the pattern of all 10 points and subjectively determine whether there
appears to be a strong correlation between x and y. b. Find the value of the correlation coefficient r and determine whether
there is a linear correlation. c. Remove the point with coordinates (1,9) and find the correlation coefficient r and determine
whether there is a linear correlation. d. What do you conclude about the possible effect from a single pair of values?
Click here to view a table of critical values for the correlation coefficient.
a. Do the data points appear to have a strong linear correlation?
No
Yes
b. What is the value of the correlation coefficient for all 10 data points?
=(Simplify your answer. Round to three decimal places as needed.)
example
C
Get more help.
Table of Critical Values
e
n
456789 OFE
10
11
12
a = .05
.950
.878
.811
.754
.707
.666
.632
.602
.576
10-
a = .01
.990
.959
.917
.875
.834
798
.765
735
708
10
X
12:09 AM
Expert Solution
This question has been solved!
Explore an expertly crafted, step-by-step solution for a thorough understanding of key concepts.

This is a popular solution!

Trending now
This is a popular solution!

Step by step
Solved in 2 steps

Recommended textbooks for you
Glencoe Algebra 1, Student Edition, 9780079039897…
Algebra
ISBN:
9780079039897
Author:
Carter
Publisher:
McGraw Hill
Glencoe Algebra 1, Student Edition, 9780079039897…
Algebra
ISBN:
9780079039897
Author:
Carter
Publisher:
McGraw Hill