Refer to the accompanying scatterplot. a. Examine the pattern of all 10 points and subjectively determine whether there appears to be a strong correlation between x and y. b. Find the value of the correlation coefficient r and determine whether there is a linear correlation. c. Remove the point with coordinates (2,9) and find the correlation coefficient r and determine whether there is a linear correlation 10- d. What do you conclude about the possible effect from a single pair of values? Click here to view a table of critical values for the correlation coefficient. Ay Table of critical values 10 a. Do the data points appear to have a strong linear correlation? a05 = 01 4. 950 990 O No 5. 878 959 Y Yes 917 6. 811 754 875 b. What is the value of the correlation coefficient for all 10 data points? 834 707 .666 798 r=-0.906 (Simplify your answer. Round to three decimal places as needed.) 10 .632 765 11 .602 735 12 576 708 13 553 684 14 532 661 15 514 641 Print Done Check answer View an example Get more help- me solve this us I208
Refer to the accompanying scatterplot. a. Examine the pattern of all 10 points and subjectively determine whether there appears to be a strong correlation between x and y. b. Find the value of the correlation coefficient r and determine whether there is a linear correlation. c. Remove the point with coordinates (2,9) and find the correlation coefficient r and determine whether there is a linear correlation 10- d. What do you conclude about the possible effect from a single pair of values? Click here to view a table of critical values for the correlation coefficient. Ay Table of critical values 10 a. Do the data points appear to have a strong linear correlation? a05 = 01 4. 950 990 O No 5. 878 959 Y Yes 917 6. 811 754 875 b. What is the value of the correlation coefficient for all 10 data points? 834 707 .666 798 r=-0.906 (Simplify your answer. Round to three decimal places as needed.) 10 .632 765 11 .602 735 12 576 708 13 553 684 14 532 661 15 514 641 Print Done Check answer View an example Get more help- me solve this us I208

Glencoe Algebra 1, Student Edition, 9780079039897, 0079039898, 2018
18th Edition
ISBN:9780079039897
Author:Carter
Publisher:Carter
Chapter4: Equations Of Linear Functions
Section4.5: Correlation And Causation
Problem 15PPS

Related questions
Question
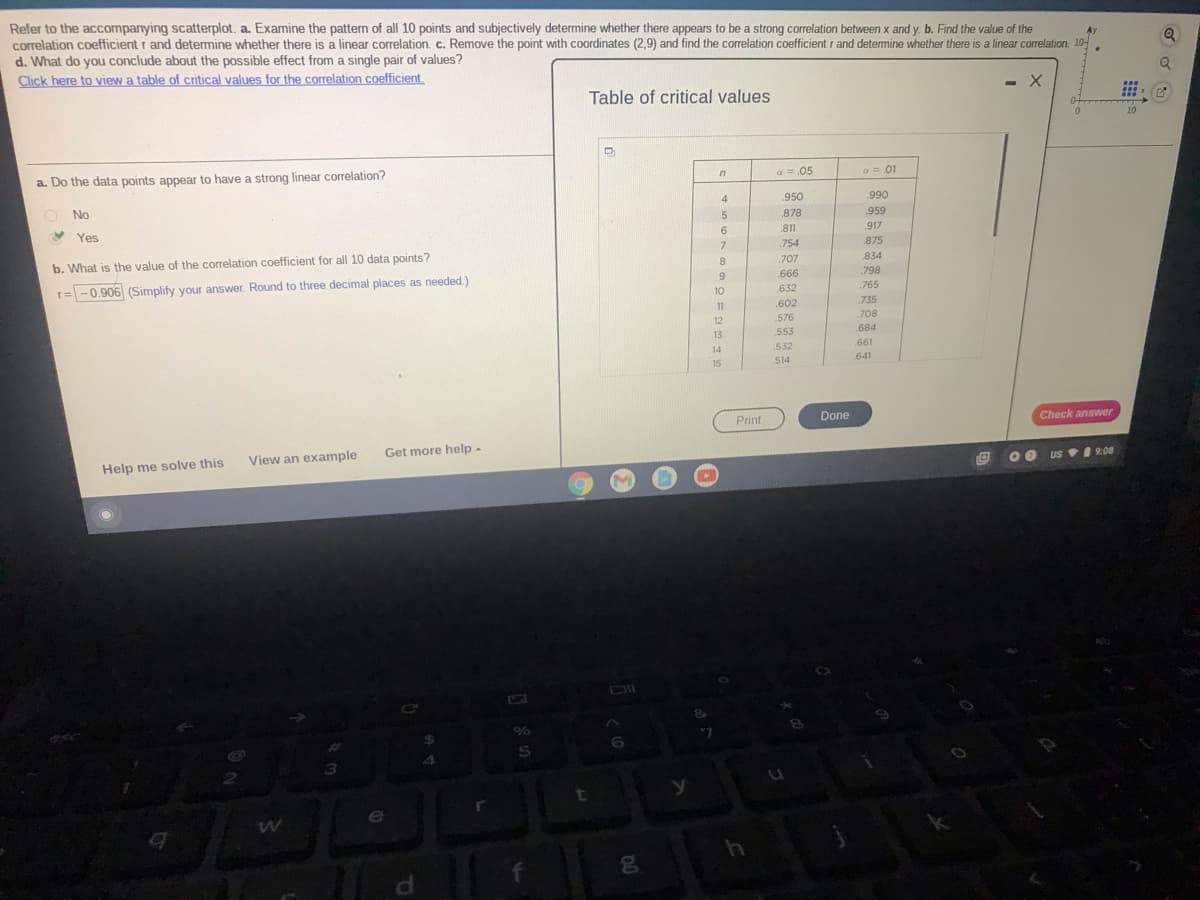
Transcribed Image Text:Refer to the accompanying scatterplot. a. Examine the pattern of all 10 points and subjectively determine whether there appears to be a strong correlation between x and y. b. Find the value of the
correlation coefficient r and determine whether there is a linear correlation. c. Remove the point with coordinates (2,9) and find the correlation coefficient r and determine whether there is a linear correlation. 10-
d. What do you conclude about the possible effect from a single pair of values?
Click here to view a table of critical values for the correlation coefficient.
AY
Table of critical values
10
a. Do the data points appear to have a strong linear correlation?
a = 05
a = 01
No
4.
.950
990
878
959
V Yes
811
.917
7.
.754
875
b. What is the value of the correlation coefficient for all 10 data points?
707
834
.666
.798
T=-0.906 (Simplify your answer. Round to three decimal places as needed.)
10
.632
765
11
.602
735
12
576
708
13
553
.684
532
.661
14
514
.641
15
Print
Done
Check answer
View an example
Get more help -
Help me solve this
uS I 2:08
2.
d.
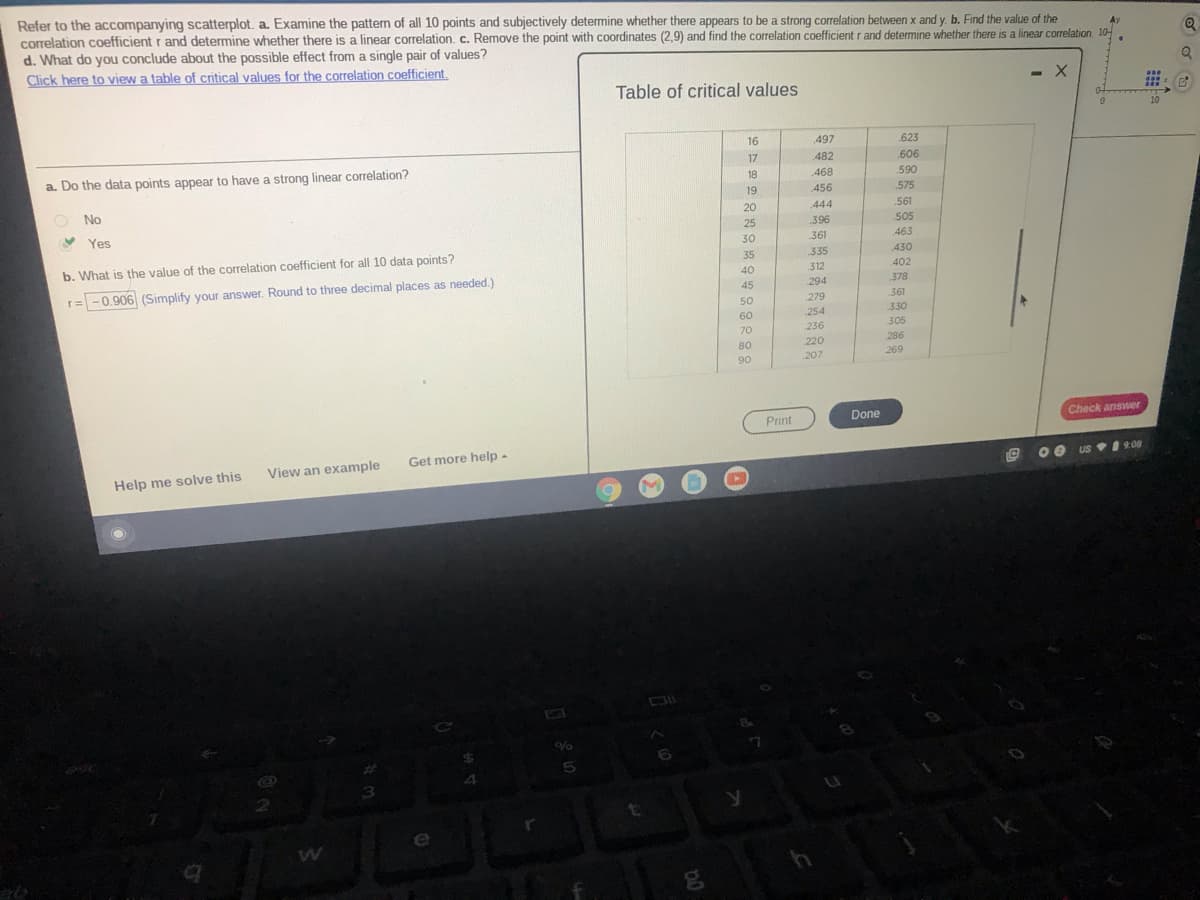
Transcribed Image Text:Refer to the accompanying scatterplot. a. Examine the pattern of all 10 points and subjectively determine whether there appears to be a strong correlation between x and y. b. Find the value of the
correlation coefficient r and determine whether there is a linear correlation. c. Remove the point with coordinates (2,9) and find the correlation coefficient r and determine whether there is a linear correlation 10-
d. What do you conclude about the possible effect from a single pair of values?
Click here to view a table of critical values for the correlation coefficient.
AY
Table of critical values
16
497
.623
17
482
.606
a. Do the data points appear to have a strong linear correlation?
590
18
468
19
456
.575
O No
444
561
20
396
505
V Yes
25
30
361
463
35
335
430
b. What is the value of the correlation coefficient for all 10 data points?
40
.312
402
378
r= -0.906 (Simplify your answer. Round to three decimal places as needed.)
294
45
50
279
361
60
254
330
236
305
70
220
286
80
207
269
90
Done
Check answer
Print
Get more help -
us I 9:08
View an example
Help me solve this
e
Expert Solution
This question has been solved!
Explore an expertly crafted, step-by-step solution for a thorough understanding of key concepts.

This is a popular solution!

Trending now
This is a popular solution!

Step by step
Solved in 3 steps

Recommended textbooks for you
Glencoe Algebra 1, Student Edition, 9780079039897…
Algebra
ISBN:
9780079039897
Author:
Carter
Publisher:
McGraw Hill
Glencoe Algebra 1, Student Edition, 9780079039897…
Algebra
ISBN:
9780079039897
Author:
Carter
Publisher:
McGraw Hill