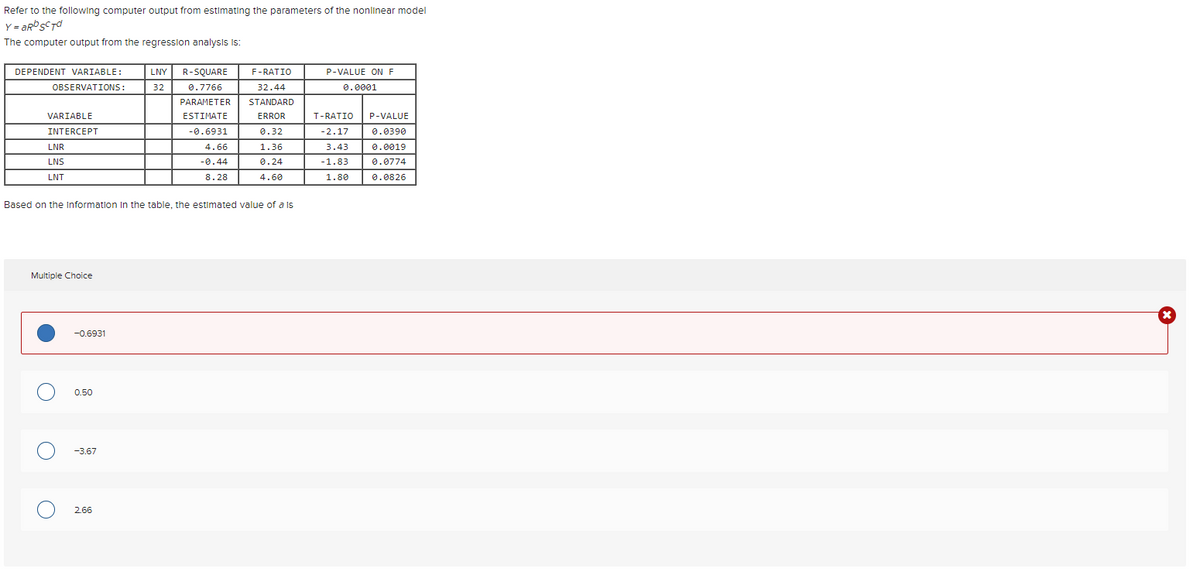
Refer to the following computer output from estimating the parameters of the nonlinear model Y=aRD SCT The computer output from the regression analysis is: DEPENDENT VARIABLE: OBSERVATIONS: LNY R-SQUARE 32 0.7766 F-RATIO 32.44 P-VALUE ON F 0.0001


Q: Use Appendix Table A.3 to answer the following. A publisher has discovered that the numbers of words…
A: Given that: Population mean, μ=20000+w Population standard deviation, σ=10000 *w is the number of…
Q: A study was undertaken to determine whether there was a significant weight (in lb) loss after one…
A: Since you have posted a question with multiple sub-parts, we will solve the first three subparts for…
Q: find the standard deviation of this probability distribution. give your answer to 2 decimal places.…
A: Given,
Q: (Solve using pen and paper) Cans of salmon are supposed to have a net weight of 6 oz. The canner…
A:
Q: A study was made to determine if the subject matter in a physics course is better understood when a…
A: It is inferred from the provided information that: For curse with lab:n1 (sample size)=11x¯1 (sample…
Q: Find the z-score for which 69% of the distribution's area lies between -z and z. -1.0152, 1.0152…
A: Z be a standard normal random variable. then z ~ N(0,1)
Q: Find the z-score such that: (a) The area under the standard normal curve to its left is 0.5202 b)…
A: Z be a standard normal random variable. then Z ~ N(0,1)
Q: The maintenance department at the main campus of a large state university receives daily requests to…
A: In the given scenario, daily request for the replacement of light bulbs in the university was…
Q: students has an average of 300 dollars and a standard deviation of 1,000. Suppose that we take a…
A: It is given that the random variable X i.e, the amount of money in savings accounts follow normal…
Q: 9) Suppose that events A and B are dependent events with P(A) = 0.37. P(B) = 0.27. and P(BIA) =…
A: It is given that P(A) = 0.37 P(B) = 0.27 P(B/A) = 0.18 Note: According to Bartleby expert…
Q: Directions: Show your work and round all answers to 4 places 1) 2 cards are drawn at random from a…
A: Total card in a standard deck is 52. Heart in a deck is 13
Q: Consider f(x) = e, x>0, and joint probability density function fxy(x,y)=e, for 0 3 Of Y13=e³-³, y3
A: given joint density function of X and Y isfXY(x,y)=e-y, for 0<x<yand marginal probability…
Q: What is the sample variance and standard deviation for the data set 9,10,11,33,4 ? Show all work.
A: Given data(x) : 9,10,11,33,4 n = 5 x x2 9 81 10 100 11 121 33 1089 4 16 ∑x=67…
Q: Given continuous random variable X ∼ Uniform[0, 9]. What is the probability that X is greater than…
A: Given that X is a continuous random variable from uniform distribution.
Q: a. Give the marginal distribution of responses. b. Give the conditional distribution of responses…
A: A table that shows the frequencies for two categorical variables is known as a two-way frequency…
Q: Use this information to answer questions 6-12: Susie is an archer. She hits the bull's-eye 79% of…
A: From the provided information, Susie hits the bull's eye 79% of the time that is p = 0.79 Sample…
Q: The degrees of freedom for the independent-samples t-test are: a. N-1 b. N c. N-2 d. N+1
A: Given that Independent-samples t-test Sample size for first group = n1 Sample size for second group…
Q: A normal distribution of scores has a standard deviation of 10 and a mean of 0. Find the z-scores…
A: It is given that Mean, μ = 0 Standard deviation, σ = 10 Note: According to Bartleby expert…
Q: population of values has a normal distribution with μ=43.8 and σ=47.2. You intend to draw a random…
A: Given that μ=43.8 and σ=47.2 X ~ Normal (μ=43.8 , σ=47.2)
Q: Following is a three-sigma (30) control chart: 1 2 3 The process is "out of control" 4 Sample #…
A: The three-sigma (3σ) control chart is given.
Q: Will upvote if show solutions in EXCEL. At one percent level of significance, are the given heights…
A: The question is about hypo. testing Given : Level of signif. ( α ) = 0.01 To find : Test whether…
Q: 99% confidence, the population proportion of adults who think the president of their country can…
A: Given that Margin of error =E =4%=0.04 Using a prior study p=44%=0.44 99% confidence.
Q: for men on the verbal portion of the SAT-I test are normally distributed with a mean of 509 and a…
A: GIVEN DATA,normal distribution μ=509σ=112we have to find out the given probabilities
Q: ose the following data represent the ratings (on a scale from 1 to 5) for a certain smart phone…
A: Hey there! Thank you for posting the question. Since there are multiple questions posted, we will…
Q: Assume that the random variable X is normally distributed, with mean u = 60 and standard deviation…
A: Given information- Population mean, µ = 60 Population standard deviation, σ = 8 Let, X be the random…
Q: reonna has purchased the life insurance policy for her fish for the price of $100 per year and…
A: Given: Insurance policy price=$100 If fishes passes away company has to give=$4000 probability of…
Q: A poll is given, showing 51% are in favor of a new building project. Let X be the number of people…
A: given data, p(favor of a new building project) = 0.51x= no of people who favor the new building…
Q: The table below shows the number of male and female students enrolled in nursing at a particular…
A:
Q: Given continuous random variable X ∼ Uniform[0, 9]. Given the condition that X is greater than 5,…
A:
Q: Describe the shape of the histogram of household size. Percent 60 50 40 30 20 10 0 1 2 3 4 5 6 7…
A: Given that histogram picture We have to describe the shape of histogram.
Q: In the class of 2019, more than 1.6 million students took the SAT. The distribution of scores on the…
A: given data normal distributionμ= 528σ = 117P(500<x<600) =?
Q: Confidence Intervals – Dr. Richards is researching the effectiveness of several new, organic types…
A: In this situation the effectiveness of several new, organic types of fertilizer has been tested and…
Q: Listed below are the numbers of words spoken in a day by each member of eight different randomly…
A: The question is about hypo. testing Given : Level of signif. ( α ) = 0.05 To find : To test the…
Q: z be a random variable with a standard normal distribution. Find the indicated probability. (Round…
A: Given that. X~N( 0 , 1 ) μ=0 , ?=1 (for standard normal distribution)
Q: An automobile insurer has found that repair claims are Normally distributed with a mean of $940 and…
A: Given information- Population mean, µ = $940 Population standard deviation, σ = $900 Let, X, be the…
Q: An assembly line produces USB keys. The probability that each of the keys produced has some type of…
A: Given that X~negative binomial (r) r=97 P=1- 0.036 =0.964
Q: keg P(A) = 0.57, P(B) = = 0.38 and P(AandB) = 0.05. Find P(BIA) In a large school, it was found that…
A: 2) It is given that, P(A) = 0.57, P(B) = 0.38 and P(A and B) = 0.05.
Q: Determine the values of the following quantities. (Round your answers to two decimal places.)…
A:
Q: When regressing Murder on the dummy variable HSEducated, the estimated coefficient on HSEducated…
A: In this case, the dependent variable is murder rate and the independent variable is the percentage…
Q: Go to artofstat.com, click on WebApps and open the Sampling Distribution for the Sample Mean for…
A: Given , that the Sampling Distribution for the Sample Mean for continuous variables graph.
Q: Consider the linear model E(Y) = XB and Var(Y) = o²I. We assume that the n x p' matrix X has a…
A: As we know that the estimated value of regression parameters holds following properties 1. Best…
Q: Answer with explanation. Will upvote. Choose from the tests and cases below. To determine whether…
A: Given that To determine whether there is a significant difference on the heights of female gorillas…
Q: A researcher conducts a two-year study comparing the number of cavities in a group of 30 randomly…
A: The question is about testing Introduction : Independent samples t test : The test is carried out…
Q: Across the United States, a staggering 69% of people are either overweight or obese. If 81 people…
A: (a) Obtain the probability that exactly 54 are either overweight or obese. The probability that…
Q: Scores for men on the verbal portion of the SAT-I test are normally distributed with a mean of 509…
A: Given that. X~N( μ , ?^2 ) μ=509 , ?=112 Z-score =( x - μ )/?
Q: Give your answer to the nearest gram.
A: From given data we have : μ=678,σ=8,n=13
Q: st period, each cyclist performed an er me to exhaustion was measured. Each ent days. On one day the…
A: Here we have to test the mean time to exhaustion is greater after chocolate milk than after a…
Q: A student goes to the library. Let event A be that the student checks out a book and event B be that…
A: Given, event A: that the student checks out a book event B: that the student uses a library…
Q: 5 cards are drawn at random from a standard deck. Find the probability that all the cards are…
A: Solution-: 5 cards are drawn at random from a standard deck. We want to find (a) P(All the cards…
Q: A 2017 study of over half a million eighth through 12th graders found that the number exhibiting…
A: a) It is needed to identify the population and sample.


Trending now
This is a popular solution!

Step by step
Solved in 2 steps

- A Ross MAP team is currently developing a regression model to explain the travel expense of HR consulting firms in a month (measured in thousands of dollars). So far, the team has identified the number of consultants, the number of clients, the number of air-travel trips, and the number of trips to high-expense cities (e.g., NYC, Boston, San Jose) as potential independent variables. A partial output of the corresponding regression model is in Figure 1. Use the figure to answer question 4to6 4. What is the R2 and adjusted R2 of the model? 5. What is the standard error of the estimates (serror) in thousands of dollars? 6. Based on what you can learn from this table, what is your assessment about the model? For your information, the firm with the lowest travel expense was $47K and the firm with the highest expense was $125K in the sample data.A researcher notes that, in a certain region, a disproportionate number of software millionaires were born around the year 1955. Is this a coincidence, or does birth year matter when gauging whether a software founder will besuccessful? The researcher investigated this question by analyzing the data shown in the accompanying table. Complete parts a through c below. a. Find the coefficient of determination for the simple linear regression model relating number (y) of software millionaire birthdays in a decade to total number (x) of births in the region. Interpret the result. The coefficient of determination is 1.___? (Round to three decimal places as needed.) This value indicates that 2.____ of the sample variation in the number of software millionaire birthdays is explained by the linear relationship with the total number of births in the region. (Round to one decimal place as needed.) b. Find the coefficient of determination for the simple linear regression model…Which of the multivariate regression parameters listed below would be best interpreted as: the predicted value on the dependent variable when all of the independent variables in the model are equal to zero. a b1 X1 R2
- Suppose that a multiple linear regression model was fit to data and that the following output resulted: Coefficients: (Intercept)exam1exam2attendance Estimate20.001.3002.5000.685 Std. Error4.2910.2610.2745.608 t value-4.6604.9819.124 0.122 Pr(>|t|)<0.0001<0.0001<0.00010.9032 Perform a backwards selection process. Select the variable that would be removed first from the model. The significance level is 0.05 for testing purposes. attendance exam2 exam1A multiple regression model is estimated with Excel and produces the following output: Dependant Variable: K Rs-qauare F-ratio p-value on f Observations: 23 0.5448 7.58 0.00157 Variable Parameter estimate Standard error t-ratio p-value Intercept -220.0 68.25 -3.22 0.0045 x -11.340 3.670 -3.09 0.0060 y 0.3875 0.0625 6.20 0.0001 z 4.26 2.350 1.81 0.0857 A. Write the regression equation based on the output. B. If X equals 50, Y equals 200, and Z equals 45, what value do you predict K will take? If X, Y, and Z are all equal to 0? C. At the 5 percent significance level, which one of the three estimated coefficients of X, Y and Z is (are) statistically significant? D. How much of the total variation is explained by this regression equation? E. Is the overall regression equation statistically significant at the 1 percent level of significance?The following is a partial computer output of a multiple regression analysis of a data set containing 20 sets of observations on the dependent variableThe regression equation isSALEPRIC = 1470 + 0.814 LANDVAL + 0.820 IMPROVAL + 13.5 AREA Predictor Coef SE Coef T P Constant 1470 5746 0.26 0.801 LANDVAL 0.8145 0.5122 1.59 0.131 IMPROVAL 0.8204 0.2112 3.88 0.0001 AREA 13.529 6.586 2.05 0.057 S = 79190.48 R-Sq = 89.7% R-Sq(adj) = 87.8% Analysis of Variance Source DF SS MS Regression 3 8779676741 2926558914 Residual Error 16 1003491259 62718204 Total 19 9783168000 For the problem above, we want to carry out the significance test about the coefficient of LANDVAL, what is the t-value for this test, and is it significant? 46.66, significant 2.05, significant 1.59, not significant 0.26, not significant
- The accompanying data resulted from an experiment in which weld diameter and shear strength (in pounds) were determined for five different spot welds on steel. Below are the data collected and the regression equation. Diameter Strength 200.1 813.7 210.1 785.3 220.1 960.4 230.1 1118.0 240.0 1076.2 Strength = -941.6992 + 8.5988*Diameter The predicted y-hat value for a diameter of 201 is 864. if we observed a weld that had a diameter of 235 that had a strength 1000, what would be its residual?The Update to the Task Force Report on Blood Pressure Control in Children [12] reported the observed 90th per-centile of SBP in single years of age from age 1 to 17 based on prior studies. The data for boys of average height are given in Table 11.18. Suppose we seek a more efficient way to display the data and choose linear regression to accomplish this task. age sbp 1 99 2 102 3 105 4 107 5 108 6 110 7 111 8 112 9 114 10 115 11 117 12 120 13 122 14 125 15 127 16 130 17 132 Do you think the linear regression provides a good fit to the data? Why or why not? Use residual analysis to justify your answer. Am I supposed to run a residual plot and QQ-plot for this question?Suppose that researchers obtain a random sample of adults ages 18 – 40 and collect data on the following variables: shoe size – in inches age – in years height – in inches forearm length – in inches Suppose further that a multiple linear regression model is fit to the resulting data set using R Studio and that the following output is obtained from it. Use this output to answer the question that follows: > summary(lm(shoesize ~ age + height + forearm, data = measures)) Coefficients: (Intercept)ageheightforearm Estimate10.14882 0.06045 -0.02108 -0.06479 Std. Error 4.49245 0.06838 0.06350 0.06847 t value2.259 0.884 -0.332 -0.946 Pr(>|t|) 0.0264 0.3792 0.7408 0.3467 Residual standard error: 1.719 on 85 degrees of freedomMultiple R-squared: 0.01983, Adjusted R-squared: 0.01477 F-statistic: 0.5731 on 3 and 85 DF, p-value: 0.6342 Which of the following is the correct interpretation of the Adjusted R-squared? The probability that our model…
- Suppose that researchers obtain a random sample of adults ages 18 – 40 and collect data on the following variables: shoe size – in inches age – in years height – in inches forearm length – in inches Suppose further that a multiple linear regression model is fit to the resulting data set using R Studio and that the following output is obtained from it. Use this output to answer the question that follows: > summary(lm(shoesize ~ age + height + forearm, data = measures)) Coefficients: (Intercept)ageheightforearm Estimate10.14882 0.06045 -0.02108 -0.06479 Std. Error 4.49245 0.06838 0.06350 0.06847 t value2.259 0.884 -0.332 -0.946 Pr(>|t|) 0.0264 0.3792 0.7408 0.3467 Residual standard error: 1.719 on 85 degrees of freedomMultiple R-squared: 0.01983, Adjusted R-squared: 0.01477 F-statistic: 0.5731 on 3 and 85 DF, p-value: 0.6342 What is the estimate for the standard deviation of the residuals? 1.719 0.01983 -0.946 0.6342Suppose that researchers obtain a random sample of adults ages 18 – 40 and collect data on the following variables: shoe size – in inches age – in years height – in inches forearm length – in inches Suppose further that a multiple linear regression model is fit to the resulting data set using R Studio and that the following output is obtained from it. Use this output to answer the question that follows: > summary(lm(shoesize ~ age + height + forearm, data = measures)) Coefficients: (Intercept)ageheightforearm Estimate10.14882 0.06045 -0.02108 -0.06479 Std. Error 4.49245 0.06838 0.06350 0.06847 t value2.259 0.884 -0.332 -0.946 Pr(>|t|) 0.0264 0.3792 0.7408 0.3467 Residual standard error: 1.719 on 85 degrees of freedomMultiple R-squared: 0.01983, Adjusted R-squared: -0.01477 F-statistic: 0.5731 on 3 and 85 DF, p-value: 0.6342 Which of the following is the correct conclusion for the F-test that was performed? There is strong evidence to…Suppose that researchers obtain a random sample of adults ages 18 – 40 and collect data on the following variables: shoe size – in inches age – in years height – in inches forearm length – in inches Suppose further that a multiple linear regression model is fit to the resulting data set using R Studio and that the following output is obtained from it. Use this output to answer the question that follows: > summary(lm(shoesize ~ age + height + forearm, data = measures)) Coefficients: (Intercept)ageheightforearm Estimate10.14882 0.06045 -0.02108 -0.06479 Std. Error 4.49245 0.06838 0.06350 0.06847 t value2.259 0.884 -0.332 -0.946 Pr(>|t|) 0.0264 0.3792 0.7408 0.3467 Residual standard error: 1.719 on 85 degrees of freedomMultiple R-squared: 0.01983, Adjusted R-squared: -0.01477 F-statistic: 0.5731 on 3 and 85 DF, p-value: 0.6342 What is the test-statistic is used to test whether at least one of the explanatory variables is a significant predictor of…