Régarding the population growth of Canada geese, which of the following statements is most likely true? The population is increasing at a constant rate with time. If modeled geometrically, A should be greater than 0, because the population is increasing. O If modeled exponentially, r should be greater than 0, because the population is increasing. None of the above statements is true.
Régarding the population growth of Canada geese, which of the following statements is most likely true? The population is increasing at a constant rate with time. If modeled geometrically, A should be greater than 0, because the population is increasing. O If modeled exponentially, r should be greater than 0, because the population is increasing. None of the above statements is true.

Biology: The Dynamic Science (MindTap Course List)
4th Edition
ISBN:9781305389892
Author:Peter J. Russell, Paul E. Hertz, Beverly McMillan
Publisher:Peter J. Russell, Paul E. Hertz, Beverly McMillan
Chapter52: Population Ecology
Section: Chapter Questions
Problem 5TYK

Related questions
Question
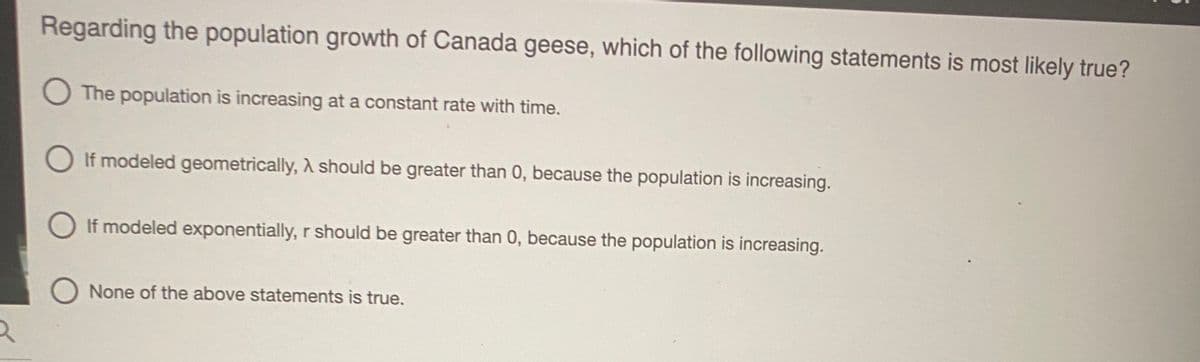
Transcribed Image Text:Regarding the population growth of Canada geese, which of the following statements is most likely true?
O The population is increasing at a constant rate with time.
O If modeled geometrically, A should be greater than 0, because the population is increasing.
If modeled exponentially, r should be greater than 0, because the population is increasing.
O None of the above statements is true.
Expert Solution
This question has been solved!
Explore an expertly crafted, step-by-step solution for a thorough understanding of key concepts.

Step by step
Solved in 3 steps

Recommended textbooks for you
Biology: The Dynamic Science (MindTap Course List)
Biology
ISBN:
9781305389892
Author:
Peter J. Russell, Paul E. Hertz, Beverly McMillan
Publisher:
Cengage Learning

Biology (MindTap Course List)
Biology
ISBN:
9781337392938
Author:
Eldra Solomon, Charles Martin, Diana W. Martin, Linda R. Berg
Publisher:
Cengage Learning
Biology: The Dynamic Science (MindTap Course List)
Biology
ISBN:
9781305389892
Author:
Peter J. Russell, Paul E. Hertz, Beverly McMillan
Publisher:
Cengage Learning
Biology (MindTap Course List)
Biology
ISBN:
9781337392938
Author:
Eldra Solomon, Charles Martin, Diana W. Martin, Linda R. Berg
Publisher:
Cengage Learning