Regression: Let's say, we want to perform linear regression on a dataset containing m examples and n features. Our output is a linear funcion as follows: Ti = W₁xi,1 + W₂x₁,2 + .....+wnxin + b Now, if the error is E, then the gradient descent weight update rules should be as follows: W₁ = w₁ - for i {1,2, ..., n} dwi b=b-ASE For the following loss functions E, find and S. SE δω. 1. Mean Squared Error: 2. Sum of Squared Error: E = 1/²1(Yi - Ti )² Swi m E = ₁ (Yi - Yi)² 3. Mean Squared Logged Error: Sometimes, yi and yi can be too large. So, we use the following loss function. m E = (log yi - log y₁)²
Regression: Let's say, we want to perform linear regression on a dataset containing m examples and n features. Our output is a linear funcion as follows: Ti = W₁xi,1 + W₂x₁,2 + .....+wnxin + b Now, if the error is E, then the gradient descent weight update rules should be as follows: W₁ = w₁ - for i {1,2, ..., n} dwi b=b-ASE For the following loss functions E, find and S. SE δω. 1. Mean Squared Error: 2. Sum of Squared Error: E = 1/²1(Yi - Ti )² Swi m E = ₁ (Yi - Yi)² 3. Mean Squared Logged Error: Sometimes, yi and yi can be too large. So, we use the following loss function. m E = (log yi - log y₁)²

Elementary Linear Algebra (MindTap Course List)
8th Edition
ISBN:9781305658004
Author:Ron Larson
Publisher:Ron Larson
Chapter2: Matrices
Section2.CR: Review Exercises
Problem 90CR

Related questions
Question
Please give a step-by-step solution.
Answer question 3.
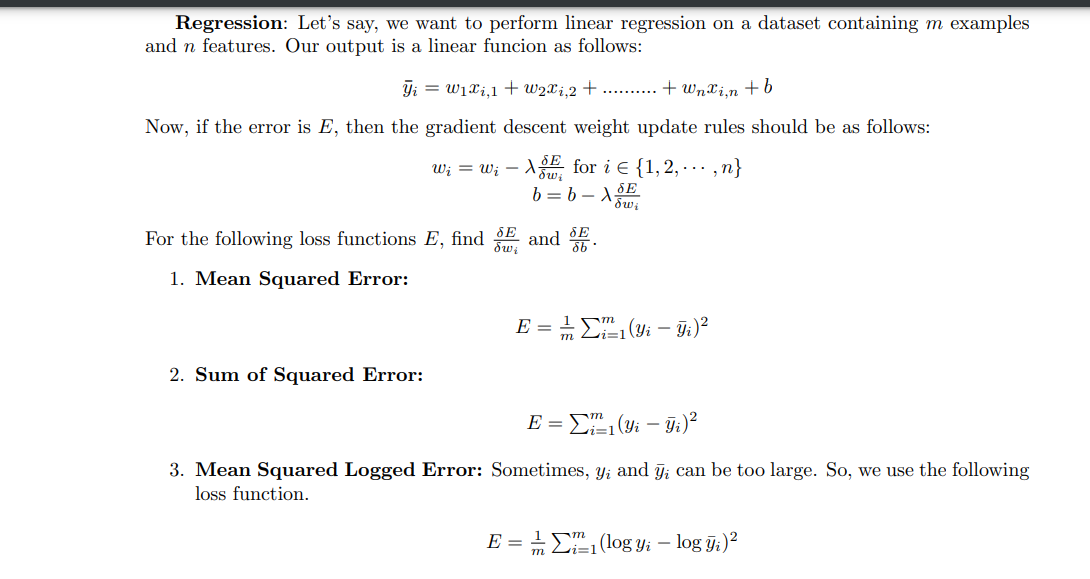
Transcribed Image Text:Regression: Let's say, we want to perform linear regression on a dataset containing m examples
and n features. Our output is a linear funcion as follows:
Y₁ = W₁x₁,1 + w2xi,2+.......... + Wnxin + b
Now, if the error is E, then the gradient descent weight update rules should be as follows:
w₁ = w₁-X for i = {1,2,...,n}
b = b - Xow₂
SE
For the following loss functions E, find and
δων
1. Mean Squared Error:
2. Sum of Squared Error:
E = 1 (Yi-Yi)²
E = ₁ (Yi - yi)²
i=1
3. Mean Squared Logged Error: Sometimes, y₁ and yi can be too large. So, we use the following
loss function.
m
E = 1/21 (log yi – log yi)²
Li=1
Expert Solution
This question has been solved!
Explore an expertly crafted, step-by-step solution for a thorough understanding of key concepts.

Step by step
Solved in 3 steps with 12 images

Recommended textbooks for you
Elementary Linear Algebra (MindTap Course List)
Algebra
ISBN:
9781305658004
Author:
Ron Larson
Publisher:
Cengage Learning

College Algebra
Algebra
ISBN:
9781305115545
Author:
James Stewart, Lothar Redlin, Saleem Watson
Publisher:
Cengage Learning

Functions and Change: A Modeling Approach to Coll…
Algebra
ISBN:
9781337111348
Author:
Bruce Crauder, Benny Evans, Alan Noell
Publisher:
Cengage Learning
Elementary Linear Algebra (MindTap Course List)
Algebra
ISBN:
9781305658004
Author:
Ron Larson
Publisher:
Cengage Learning
College Algebra
Algebra
ISBN:
9781305115545
Author:
James Stewart, Lothar Redlin, Saleem Watson
Publisher:
Cengage Learning
Functions and Change: A Modeling Approach to Coll…
Algebra
ISBN:
9781337111348
Author:
Bruce Crauder, Benny Evans, Alan Noell
Publisher:
Cengage Learning

Linear Algebra: A Modern Introduction
Algebra
ISBN:
9781285463247
Author:
David Poole
Publisher:
Cengage Learning

Algebra & Trigonometry with Analytic Geometry
Algebra
ISBN:
9781133382119
Author:
Swokowski
Publisher:
Cengage