Regressionn output for predicting the time (in minutes) for baseball games on the number of hits is given below. Interpret the value of R2.
Regressionn output for predicting the time (in minutes) for baseball games on the number of hits is given below. Interpret the value of R2.

Glencoe Algebra 1, Student Edition, 9780079039897, 0079039898, 2018
18th Edition
ISBN:9780079039897
Author:Carter
Publisher:Carter
Chapter4: Equations Of Linear Functions
Section: Chapter Questions
Problem 4SGR

Related questions
Question
40
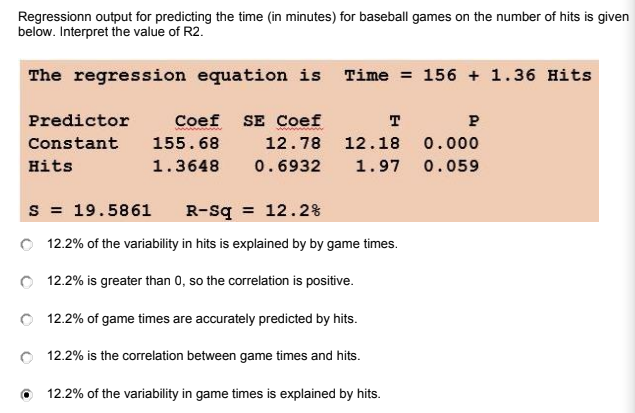
Transcribed Image Text:Regressionn output for predicting the time (in minutes) for baseball games on the number of hits is given
below. Interpret the value of R2.
The regression equation is Time = 156 + 1.36 Hits
Predictor
Coef
SE Coef
T
Constant
155.68
12.78 12.18 0.000
Hits
1.3648
0.6932
1.97
0.059
s = 19.5861
R-sq = 12.2%
%3D
O 12.2% of the variability in hits is explained by by game times.
O 12.2% is greater than 0, so the correlation is positive.
O 12.2% of game times are accurately predicted by hits.
O 12.2% is the correlation between game times and hits.
12.2% of the variability in game times is explained by hits.
Expert Solution
This question has been solved!
Explore an expertly crafted, step-by-step solution for a thorough understanding of key concepts.

This is a popular solution!

Trending now
This is a popular solution!

Step by step
Solved in 2 steps with 2 images

Recommended textbooks for you
Glencoe Algebra 1, Student Edition, 9780079039897…
Algebra
ISBN:
9780079039897
Author:
Carter
Publisher:
McGraw Hill


Algebra & Trigonometry with Analytic Geometry
Algebra
ISBN:
9781133382119
Author:
Swokowski
Publisher:
Cengage
Glencoe Algebra 1, Student Edition, 9780079039897…
Algebra
ISBN:
9780079039897
Author:
Carter
Publisher:
McGraw Hill
Algebra & Trigonometry with Analytic Geometry
Algebra
ISBN:
9781133382119
Author:
Swokowski
Publisher:
Cengage

Functions and Change: A Modeling Approach to Coll…
Algebra
ISBN:
9781337111348
Author:
Bruce Crauder, Benny Evans, Alan Noell
Publisher:
Cengage Learning

Big Ideas Math A Bridge To Success Algebra 1: Stu…
Algebra
ISBN:
9781680331141
Author:
HOUGHTON MIFFLIN HARCOURT
Publisher:
Houghton Mifflin Harcourt