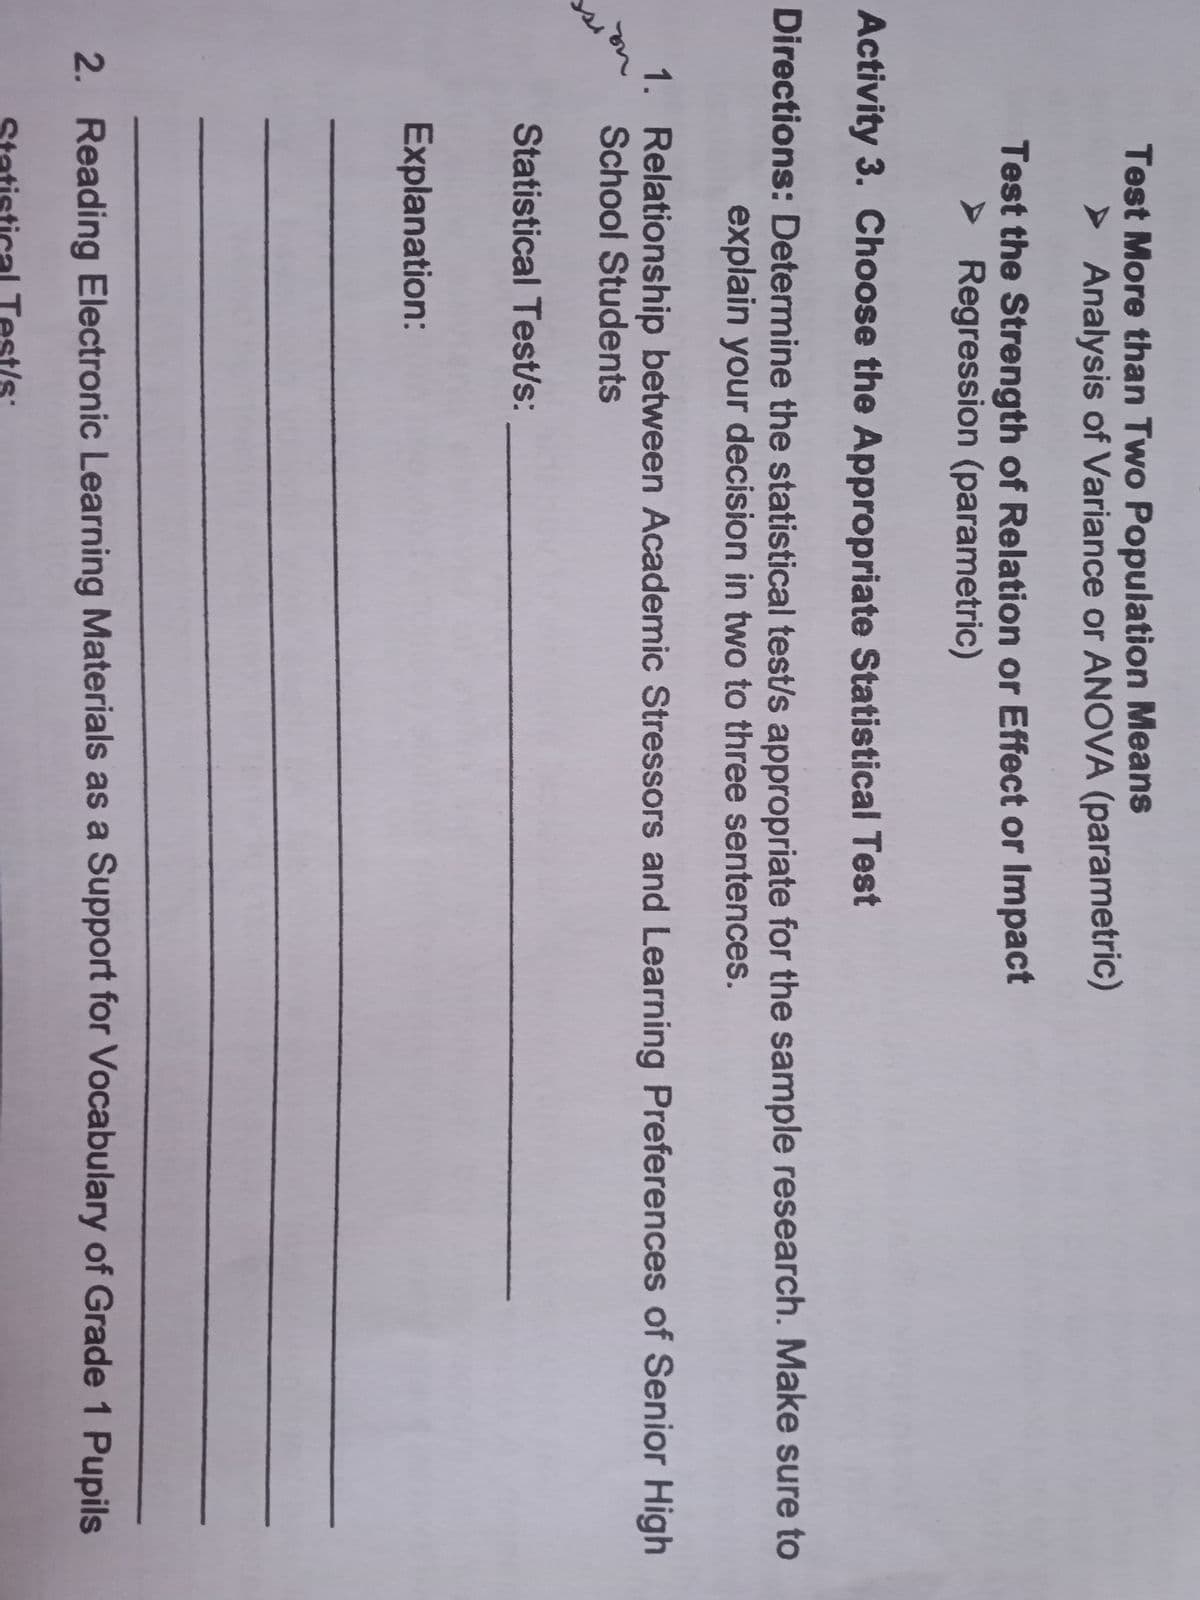
Relationship between academic stressors and learning preferences of senior high school students Statistical tests: Explanation:


Q: The comparisons of Scholastic Aptitude Test (SAT) scores based on the highest level of education…
A: Given that,
Q: Ap-value is the highest level (of significance) at which the observed value of the test statistic is…
A: The p-value is the likelihood of obtaining the value of sample statistic which would be as extreme…
Q: Health insurance benetits vary by the size of the company (the Henry J. Kaiser Family Foundation…
A: The observed value (Oi) is: Size of company Yes No Total Small 40 10 50…
Q: what is a statistical test and test value? give an example
A: The statistical test is very helpful in statistics while conducting the survey or in research. So…
Q: What type of information about individuals is primarily used to select participants for a…
A: Case-control study: A case-control study is a type of observational study. These studies are used…
Q: Discussion Question: Provide an example of a within-subjects research study on which you could use a…
A: From the given information, Within-subject research- It is that sort of investigation design in…
Q: Considering the significance test of a correlation coefficient, for a two-tailed test, what is the…
A: Solution: From the given information, r=0.7255 and n=7. Here, the test is about the correlation…
Q: Examples of the independent and paired-samples t-test?
A: 1): Example of independent and paired two sample t-test: Insulin rate is measured on few…
Q: Research Title: Relationship between Academic Stressors and Learning Preferences of Senior High…
A: Given data is quantitative research design and experiment of the academic stressors and learning…
Q: Hi, my question is about determining what descriptive measure is appropriate to describe a set of…
A: We cannot conclude that the 3 learners have equal performance. Though the means are equal for all…
Q: Identify the statistical procedures that are appropriate for the data. When possible, identify…
A: A researcher is investigating the relationship between personality and birth order position. A…
Q: Researchers test the effects of sunlight on depression levels in humans. They randomly sort subjects…
A: Given Information: Researchers test the effect of sunlight on depression levels in humans. ANOVA…
Q: The Survey of Study Habits and Attitudes (SSHA) is a psychological test designed to measure various…
A:
Q: what measure of central tendency would you use to cpmpute the following data? a.) Blood types:…
A:
Q: Descriptive or inferential statistic when examining 3k luxury cards in Stanton VA
A: Solution A descriptive statistics shows the measure of Center, variability and measure of…
Q: What type of statistical test would you use to address the following research question: Do chemistry…
A: The paired-samples t-test is used to compare the means of two related populations and it establishes…
Q: The prices of two competitive companies (Company I and Company II) need to be studied in order to…
A: Given, n1=15x1=33.4s1=1.3n2=17x2=32.4s2=1.5α=1-0.93=0.07 Since the population are approximately…
Q: Measures of central tendency are Inferential statistics that identify the best single value for…
A: Measures of central tendency : Measures of central tendency are the inferential statistics that…
Q: You collect data on number of hours spent studying, on average, throughout the Fall 2020 semester…
A: Statement: The Statistical test used to compare the students at Stonehill and Holy Cross to look…
Q: a. What is the relevant population. b. What is the variable of interest? Is it quantitative or…
A: Hi! Thank you for posting the question. Since you have posted multiple parts, we are answering first…
Q: Scenrio :Data from the Motor Vehicle Department indicate that 80% of all licensed drivers are older…
A:
Q: INSTRUCTION(S): 1. Analyze the given data using 2 or more statistical tool 2. Interpret results and…
A:
Q: “Bullying,” according to noted expert Dan Olweus, “poisons the educational environment and affects…
A: Given Information: Victims: Sample size (n1) = 25 Sample mean (x¯1) = 25.3 Sample standard deviation…
Q: Relationship between Academic Stressors and Learning Preferences of Senior High School Students what…
A: Chi-square test for independence compares two variables in the contingency table to see whether they…
Q: THE IMPACT OF DRINKING COFFEE FOR ACADEMIC PERFORMANCES OF THE PARTICIPANTS
A: Given information: The data represents the values of the variables x = Number of cups and y =…
Q: You give all Stonehill students a measure of well-being (i.e. happiness) when they enter as first…
A: Here there is four samples. We want to test whether there is significant differences of well being…
Q: Math Score Writing Score 540 474 432 380 528 463 574 612 448 420 502 526 480 430 499 459 610 615 572…
A: State the hypotheses. That is, there is no significant difference between the population mean for…
Q: Question Help Research subjects were followed from adolescence to adulthood, and all the people in…
A: Expected value formula for the given table is, Expected value=( Row total*Column total)/n So we add…
Q: ou want to run an ANOVA looking at the effect of attending review sessions on students’ statistics…
A: In repeated measures ANOVA we take many observations of one single unit. For example marks in…
Q: Houston North Hospital is trying to improve its image by providing a positive experience for its…
A:
Q: CONFLICT RESOLUTION 4 of 4 What is your statistical decision? The Center for the Study of Violence…
A: Let μd be the mean difference between before participating and after participating. The hypothesis…
Q: Relationship between Academic Stressors and Learning Preferences of Senior High School Students…
A: Relationship between Academic Stressors and Learning Preferences of Senior High School Students…
Q: What is the statistical test of this? And please explain? Relationship between Academic Stressors…
A: Given, What is the statistical test of this? Relationship between Academic Stressors and Learning…
Q: Different techniques in describing the data using measures of central tendency and measures of…
A: Measure of central tendency- It is a single value defines a set of data by choosing the central…
Q: You collect data on number of hours spent studying, on average, throughout the Fall 2019 semester…
A: One sample t test used for single mean Two sample t yest use for difference between two groups means…
Q: a. Arrange the data from the lowest number of cases to the highest number of cases, indicating the…
A: Given data indicates the number of COVID 19 cases in different regions of Phillipines.
Q: ncance. Ho: Diagram: H1: Statistical Variables: P-Value: Test Statistic: Conclusion and…
A: O E (O-E)^2 (O-E)^2/E 16 17.84937 3.420178 0.191613 22 20.16318 3.373908 0.16733 26 23.46862…
Q: Gender and Frequency of Status Updates on Facebook The Pew Research Center conducted a survey of…
A: Hypotheses: Null hypothesis: Frequency of status updates and gender are not related. Alternative…
Q: Which is NOT an example of statistical bias? Response Bias Observer Effect Recall…
A: Response bias is the bias wherein the response of the individual in survey can be influenced.…
Q: Calculate and interpret the sample correlation coefficient between gambling and family abuse.
A: X Y (x-xbar) (x-xbar)^2 (y-ybar) (y-ybar)^2 (x-xbar)*(y-ybar) 47 1022 -102.3265 10470.7189…
Q: In Advanced Statistical Inference: What is the relationship between the sufficiency, ancillary, and…
A: The relationship between the sufficiency, ancillary, and completeness is provided below: Let V and T…
Q: The number of daily proposals received by a developing country's government from enterprises…
A:
Q: Flight Departure Delays Listed below are departure delay times (minutes) for American Airline…
A: State the test hypotheses. Let μ1 be the mean of the departure delay times for flight 1, μ2 be the…
Q: 1.Relationship between academic stressors and learning preference of senior high school student…
A: We need to find a statistical test that can determine the relationship between academic stressors…
Q: opulation parameters are always point estimators of sample statistics O True O False
A: Given that Parameter based on population and statistics based on sample.
Q: Effects of Preferences on Study Habits to the Academic Performance of Grade 11 students. What is the…
A: q-1 effects of preferences on study habits to the academic performances of grade 11 students. what…
Q: Using this information to conduct a hypothesis test to investigate if introducing a loyalty program…
A:
Relationship between academic stressors and learning preferences of senior high school students
Statistical tests:
Explanation:


Trending now
This is a popular solution!

Step by step
Solved in 2 steps


- What procedure is used to test whether two interval or ratio variables are related or not?A. Correlation AnalysisB. Two-sample t-testC. Chi-square testD. Analysis of VarianceTrue or False: Explain Suppose that OLS is unbiased for the following bivariate model: Y = B0 +B1X +u and suppose that the true slope coefficient B1 = 7. If you use the standard t-statistic to test the null hypothesis that the slope coefficient is equal to 0, the probability that you will reject the null hypothesis will increase if you reduce your sample size.A researcher wants to measure average cardiovascular health of university students and compare those scores to the average scores in the general population. Assuming that population variance is known, what statistical test is most appropriate for this study? independent-samples t-test single-sample t-test z-test for sample mean related-samples t-test
- An economist wishes to determine whether there is evidence that the average family income in a community is less than $75,000 or not. Should she use a two-tail or upper tail or lower tail hypothesis test? Explain. (d) Briefly explain the steps needed for a completely randomized experimental design in Analysis of Variance. Give a real world example to clarify. Use at least 8 sentences to answer this question. (e) What is multiple regression analysis? What are the differences between the simple linear regression analysis and the multiple regression analysis? Give a real world example to clarify. Use at least 8 sentences to answer this question.To help assess the health risks of second-hand smoke, the levels of cotinine (a metabolite of nicotine) were measured in mmol/l in the urine of seven subjects prior to exposure to second-hand smoke and shortly after a two-hour exposure to secondary cigarette smoke. Did the exposure significantly increase the cotinine level? What will be the appropriate statistical analysis to use in this problem? a. z-Test for Comparing Two Means from Independent Populations b. t-Test for Comparing Two Means when the Samples are Dependent c. z-test for comparing the difference between two proportions d. t-Test for Comparing Two Means from Independent Samples e. F-test in Comparing the Difference Between Two VariancesThe goal of analysis of variance (ANOVA) is toa. detect differences in treatment variances (or variances for different populations).b. detect differences in treatment means (or means for different populations).c. analyze the average variances for different populations.d. analyze the variances of the variances for different populations.
- A researcher who wanted to understand whether there was a significant difference between the average grades of the students from 3 different courses obtained the following data (Same number of samples was taken). a) In the table containing the data for variance analysis, “?” Find the data indicated by the sign and the number of samples.b) Test whether there is a significant difference between the means at the 5% significance level.1. What is the difference between an influential point and an outlier 2. If the regression line is not a "good fit" what would be better to use to approximate a response variable? 3. What information does a residual plot give usWhen can you use the Chebyshev criterion, and when you cannot? If the Cebyshev criterion cannot be used how do you determine that your model is a good fit to the data set?
- One sample is selected to represent scores in treatment 1 and a second sample is used to represent scores in treatment 2. Which set of sample statistics would present the clearest picture of a real difference between the two treatments? Group of answer choices M1 = 36; M2 = 40; and both variances =43 M1 = 38; M2 = 40; and both variances =43 M1 = 36; M2 = 40; and both variances =6 M1 = 38; M2 = 40; and both variances =6An experiment was conducted into various phobias, by the department of Psychology at Lowlands University. One hundred subjects were shown pictures of things that typically induce fear (spiders, violence, extreme heights, bloody wounds etc). They were then asked how frightened they were. State whether or not the data is suitable for analysis using correlation and regression, and explain fully why you have reached that conclusion. Observation Not frightened A little frightened Frightened Terrified 1 Spiders 2 Zombies 3 Blood 4 House fire 5 Clowns 6 Vampires 7 Explosions 8 Surgeries 9 Exam rooms 10 Job centresTrue or False: In order to perform an analysis of variance (ANOVA), the response variable must be quantitative.