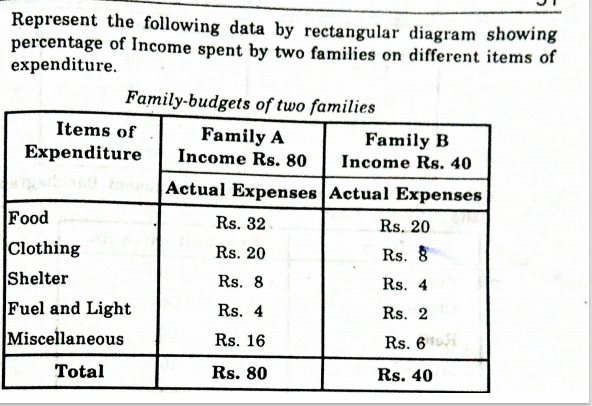
Represent the following data by rectangular diagram showing percentage of Income spent by two families on different items of expenditure. Family-budgets of two families Items of Family A Income Rs. 80 Family B Income Rs. 40 Expenditure Actual Expenses Actual Expenses Food Rs. 32 Rs. 20 Clothing Shelter Rs. 20 Rs. 8 Rs. 8 Rs. 4 Fuel and Light Rs. 4 Rs. 2 Miscellaneous Rs. 16 Rs. 6 Total Rs. 80 Rs. 40
Q: student has a monthly budget of $150 to spend on either coke, which cost $5 each, or biryani, which…
A: Budget constraint represents all the combinations of goods and services a consumer can consume with…
Q: Define the following terms showing how they are calculated: Gross Domestic Product Gross Domestic…
A: Macroeconomic variables: Macroeconomics is a branch of economics concerned with the study of an…
Q: Investment is defined as what consumers do with their savings. financial capital. O spending on…
A: Investment refers to addition of new capital by firms into their businesses with the goal of…
Q: What would be the value of APC if Consumption is $3300 and income is $10,000
A: The data presented in the question above is:- Consumption = $3300 Income = $10,000 We need to…
Q: Calculate the value of APC when Consumption is given to be $230 and the income is $500
A: We can calculate the value of Average propensity to consume by didi Consumption by savings. APC = C…
Q: What is the type of consumption of household spending which is independent
A: Consumption is referred to as the usage of goods and services by individuals.
Q: Suppose you had a choice between living in the United States in 1900 with an income of $991,000 per…
A: Inflation is a component that caters to problematic situations in an economy wherein the price…
Q: What is it mean by full price and income when discussing household consumption?
A: Household consumption includes all purchases or consumption made to meet their daily needs by…
Q: Taking the data of the following table answer 4 through 5. Indicators of Puerto Rico, 2009 (Income…
A: Gross product is the total market value of product produced domestically ina year.
Q: Your answer: 1 Countries with a high gross domestic product are low consumers of energy. 2…
A: There is direct relationship in energy consumption and gross domestic product.
Q: Compute the GNP using the Income Approach and Expenditure Approach.
A: GNP is the Gross National Product of an economy. It can be defined as the sum of the value of all…
Q: Use the diagram below to answer the questions that follow. V J CONSUMER GOODS CAPITAL GOODS
A: The production possibilities frontier (PPF) is a basic production economic model used to outline how…
Q: consumption of income is $390 and APC is 0.34
A: APC is the Average Propensity to Consume Formula: APC = C/Y where, APC = Average Propensity to…
Q: Why does the general public often refer to the cost-of-living index?
A: The economy consists of different type of people in it. There will be some with high financial…
Q: Adam's Ribs in downtown Chicago buys $10,000 worth of beef ribs, $25,000 worth of pork ribs, and…
A: Gross domestic product is used to measure economic growth in terms of output produced or income…
Q: Use the data below related to price of some goods and services to answer the following requirements:…
A: Consumer Price Index (CPI) measures the relative change in price of a basket of goods and services…
Q: If a person works a standard 8 hour day he will be at Point C on the graph. At C, how many hours of…
A: Here, we are assuming that there are 24 hours in a day that a person can divide between working…
Q: Consider the simple circular flow diagram. The amount of consumer expenditures on goods and services…
A: Circular flow refers to the continuous and recurrent transfers of money among households and…
Q: Do households make a distinction between spending for current expenses and spending for capital…
A: Households in different countries have different sets of income patterns. People want to spend on…
Q: The withdrawal of income from circular flow of income example saving is known as _______
A: According to the given question The circular flow of income in an economy is a concept in the…
Q: 6. This question is based on the following table. Household Income Average number of car per…
A: Answer: option c (direct) Explanation: According to the table, as the income increases the average…
Q: The table contains data on the relationship between saving and income. Rearrange these data into a…
A: The data can be re arranged by ascending order that is lower income to higher income. The income…
Q: Optimizing economic agents use the real interest rate when thinking about the economic costs and…
A:
Q: The distribution of income is ultimately determined by (a) the distribution of the ownership of the…
A:
Q: Which one of the following is NOT a possible relationship between income and spending Select one: a.…
A: The equation that shows the relationship between the income and spending is written as C=a+bYd Yd is…
Q: 1. Consider a two-period model in which you work and save in the initial period (period 0) and live…
A: Since you have asked a multi-part question and according to the policy, we can only solve the first…
Q: Assuming that the substitution effect is large relative to the income effect, tax reform designed to…
A: Substitution effect: It states that if there is an increase in the price of a good then consumers…
Q: Explain with the help of a diagram the circular flow of income. Identity the parts of the model that…
A: The circular flow of income help understands the flows of activities such as the production of goods…
Q: To help Janette cover her college expense, parents provide Janette with a monthly allowance of $340.…
A:
Q: Indicate whether each of the following relationships is usually a direct relationship or an inverse…
A: Note: Since we only answer up to 3 sub-parts, we’ll answer the first 3. Please resubmit the question…
Q: Calculate the value of APS if savings is $990 and income is $2100
A: The information we have is as follows:- Savings = $990 Income = $2100 We have to calculate the value…
Q: QUESTION 1 Table 1 gives data on weekly family consumption expenditure (Y) (in dollars) and weekly…
A: Household final consumption expenditure is the amount a resident household spends on goods or…
Q: 1. ………………..enables users to identify the real similarities and differences in economic phenomena…
A: ANSWER: Faithful representation
Q: A line represents income being allocated to a certain type of expenditure such as an individuals…
A: A budget line represents all combination of two goods which can be used or consumed by the consumer…
Q: Table 1 gives data on weekly family consumption expenditure (Y) (in dollars) and weekly family…
A: a)
Q: The four categories of income in the economy are: O wages, rent, interest, profit O consumption,…
A: The inputs which are used for the production of a service or a good are referred to as factors of…
Q: 1. Table 1 is the data for the per week household consumption Y and income X in the US. Table 1 data…
A: "Since you have posted a question with multiple sub-parts, we will solve the first three subparts…
Q: The following table contains monthly housing expenditures for 10 families. (i) Find the average…
A: Since you have posted a question with multiple sub-parts, we will solve the first three sub-parts…
Q: QUESTION 1 Table 1 gives data on weekly family consumption expenditure (Y) (in dollars) and weekly…
A: The answer of question no. (a) E(Y|X=80) 65E(Y|X=100) 77E(Y|X=120) 89E(Y|X=140) 101E(Y|X=160)…
Q: An example of a flow variable is a. capital. b. consumption expenditure by households. c. the…
A: A flow variable has always been a quantifiable variable that is assessed throughout time. It has a…
Q: Describe the consumption pattern of the consumer based on the table below unit MU/P (sundae)…
A: Consumption of goods and services gives utility to the consumer, so consumer consume in a manner…
please solve tihis question
thanks
Trending now
This is a popular solution!
Step by step
Solved in 3 steps with 1 images
- Eren’s two main hobbies are taking vacations overseas (V) and eating expensivemeals (M). His utility function is given as: U(V,M) = V2MLast year, the average price of taking a vacation overseas was US$200 and the averageprice of an expensive meal is $50. However, due to supply problems in Onions, theaverage price of an expensive meal rose to $75. The average price of a vacation did notchange. His income, which is $1500, did not change. Calculate for the equivalent variation (EV) for the price change.Eren’s two main hobbies are taking vacations overseas (V) and eating expensivemeals (M). His utility function is given as: U(V,M) = V2MLast year, the average price of taking a vacation overseas was US$200 and the averageprice of an expensive meal is $50. However, due to supply problems in Onions, theaverage price of an expensive meal rose to $75. The average price of a vacation did notchange. His income, which is $1500, did not change. Calculate the change in consumer surplus from consuming the expensivemeals considering the price change (Hint: you need to compare his optimalconsumption bundle before and after the price change to get the change in CS).Eren’s two main hobbies are taking vacations overseas (V) and eating expensivemeals (M). His utility function is given as: U(V,M) = V2MLast year, the average price of taking a vacation overseas was US$200 and the averageprice of an expensive meal is $50. However, due to supply problems in Onions, theaverage price of an expensive meal rose to $75. The average price of a vacation did notchange. His income, which is $1500, did not change. Suppose that the Department of Welfare wants to know how much should begiven to Eren to offset his change un utility due to the price increase of an expensivemeal. Calculate the compensative variation (CV).
- 24. Given this diagram, what is the simple income multipier? a) 1/2 b) 2 c) 10 d) 70 e) 80 f) 100Eren’s two main hobbies are taking vacations overseas (V) and eating expensive meals (M). His utility function is given as: U(V,M) = V^2MLast year, the average price of taking a vacation overseas was US$200 and the average price of an expensive meal is $50. However, due to supply problems in Onions, the average price of an expensive meal rose to $75. The average price of a vacation did not change. His income, which is $1500, did not change. Suppose that the Department of Welfare wants to know how much should be given to Eren to offset his change un utility due to the price increase of an expensive meal. Calculate the compensative variation (CV).Assuming a chocolate bar costs $4 each and a bottle of wine $25. a) Graphically depict (and provide an appropriate title) the behavior of the following three individuals according to a model we have studied and then given information: Alex with an income $1000, Sandra with an income of $750, and Bo with an income of $1200. b) Can you indicate the level of actual consumption given the information in the problem? If yes, why? If no, why not?
- Suppose Matt’s income is $120. He plans to spend it on two goods bread and avacado. Prices are: Pb = $4 per loaf of bread, Pa = $1 per avocado If Matt spends all his income on loafs of bread, how many does he buy? If Matt spends all his income on avocadoes, how many does he buy? If Matt buys 10 loaf of bread, how many avocados can he buy? Plot each of the bundles from parts A – C on a graph that measures avocadoes on the horizontal axis and loaves of bread on the vertical axis, connect the dots to find Matt’s budget constraint. Show what happens to the budget constraint if his income falls to $100, (prices do not change). Show what happens to the budget constraint if price of avocado rises to Pa = $2 per avocado, (income and price of loaves of bread did not change).Co. XYZ manufactures a productand sells it for $8 per unit. Her fixedcosts are $5,000 and her variablecost per unit is given by the equationCalculate the equilibrium quantity qalgebraically. 2.444 (X)-2200 A. (q-800) B. q=900 C. (q 650) D. None of the above In the previous problem (27), calculate the amount ofequilibrium Total Income. A. 4,500 B.$3,000 C. $7,200 D. $9,000 In the above problem (27), calculate thebreak-even Total Cost amount. A. 4,500 B. $3,000 C. $9,200 D. 7,200 In the previous problem (27)determine the profit when q-1800.modes of A. $4,500 B. 5,000 C.$6,000 D. 7,000 In the previous problem (27), determine the gain when q-450. A. $2,500 B. -$2,500 C.$6,000 D. -$4,500 In the aboveproblem (27), find the required output (q), to make a profit of$10,000. A. 3,000 B. 4,000 C. 2,500D. 2,700On a given evening, J. P. enjoys the consumption of cigars (c) and brandy (b) according tothe functionU(c, b) = 20c− c²+ 18b − 3b²a. How many cigars and glasses of brandy does he consume during an evening? (Cost isno object to J. P.)b. Lately, however, J. P. has been advised by his doctors that he should limit the sum ofglasses of brandy and cigars consumed to 5. How many glasses of brandy and cigarswill he consume under these circumstances?
- which is the most preferred level of individual’s choice for public expenditure relating it with individual’s utility dependence, by considering three different groups? also draw the graph and intrepret it.EXERCISE 1Below is a production possibilities table for consumer goods (Food) and capital goods(Robots):A B C D EFood 0 1 2 3 4Robots 10 9 7 4 01. Show these data graphically. Upon what specific assumptions is this productionpossibilities curve based?2. If the economy is at point C, what is the cost of one more food? Of one morerobot? Explain how the production possibilities curve reflects the law ofincreasing opportunity costs.3. If the economy characterized by this production possibilities table and curvewere producing 3 food and 2 robots, what could you conclude about its use ofavailable resources?4. What would production at a point outside the production possibilities curveindicate? What must occur before the economy can attain such a level ofproduction?EXERCISE 2Explain how (if at all) each of the following affects the location of a country’s productionpossibilities curve:1. The quality of education increases.2. The number of unemployed workers increases.3. A new technique…Prepare a SWOT analysis using the details below. Maria is planning to open up a Cafeteria near her house. She closed her previousCafeteria few months ago because the rental keeps getting higher and the income is decliningbecause of the COVID19 pandemic. It came up to her the idea to open again since a lot ofpeople are asking for online delivery of their favorite snacks offered in her shop since most ofthe people would stay at home and would prefer food delivered in their doorsteps. Since sheowned a vacant lot near her house, and she thought that re-opening her shop in that locationwould be a great idea and she will not pay rentals anymore. And her Café Services will stillcontinue but with the added services like the Food Panda does.