REQUIREMENTS: 1. Using Microsoft EXCEL, plot the above data set on a graph so that you can show the geometric interpretation with appropriate calibration on the vertical sand horizontal axis for PRICE and QUANTITY, respectively. 90 80 70 60 50 40 30 20 10 500 600 100 200 300 400 700 800 900 Quantity Demanded (Qd) 2. Compute for the pure value of Price Elasticity of demand at every Point (A, B, C, D, E, F, G, H, and I). 3. Interpret the computed Elasticity value at each POINT. 4. Compute for the Total Revenue (TR) at each POINT. At what POINT is TR maximum? Explain. 5. Examine the relationship(s) between Elasticity Value and TR at each POINT. PRICE
REQUIREMENTS: 1. Using Microsoft EXCEL, plot the above data set on a graph so that you can show the geometric interpretation with appropriate calibration on the vertical sand horizontal axis for PRICE and QUANTITY, respectively. 90 80 70 60 50 40 30 20 10 500 600 100 200 300 400 700 800 900 Quantity Demanded (Qd) 2. Compute for the pure value of Price Elasticity of demand at every Point (A, B, C, D, E, F, G, H, and I). 3. Interpret the computed Elasticity value at each POINT. 4. Compute for the Total Revenue (TR) at each POINT. At what POINT is TR maximum? Explain. 5. Examine the relationship(s) between Elasticity Value and TR at each POINT. PRICE

Microeconomics A Contemporary Intro
10th Edition
ISBN:9781285635101
Author:MCEACHERN
Publisher:MCEACHERN
Chapter5: Elasticity Of Demand And Supply
Section: Chapter Questions
Problem 13PAE

Related questions
Question
SUBJECT:
COURSE CODE: BEC 101
ANSWER NUMBER FIVE ONLY
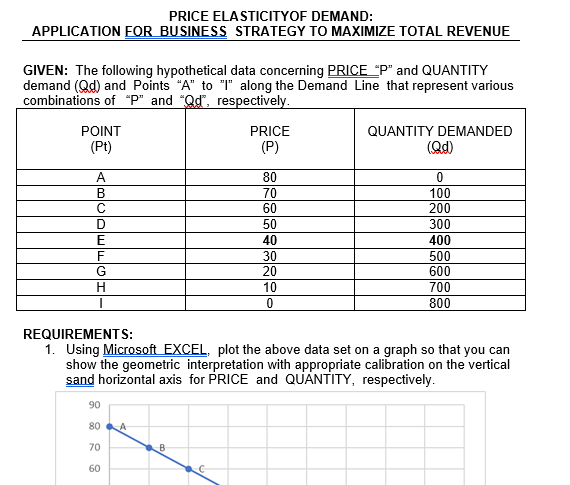
Transcribed Image Text:PRICE ELASTICITYOF DEMAND:
APPLICATION FOR BUSINESS STRATEGY TO MAXIMIZE TOTAL REVENUE
GIVEN: The following hypothetical data concerning PRICE "P" and QUANTITY
demand (Qd) and Points "A" to "I" along the Demand Line that represent various
combinations of "P" and "Qd", respectively.
POINT
PRICE
QUANTITY DEMANDED
(Pt)
(P)
(Qd)
A
80
В
C
70
60
100
200
50
300
40
400
30
20
500
600
G
10
700
800
REQUIREMENTS:
1. Using Microsoft EXCEL, plot the above data set on a graph so that you can
show the geometric interpretation with appropriate calibration on the vertical
sand horizontal axis for PRICE and QUANTITY, respectively.
90
80
A
70
B
60
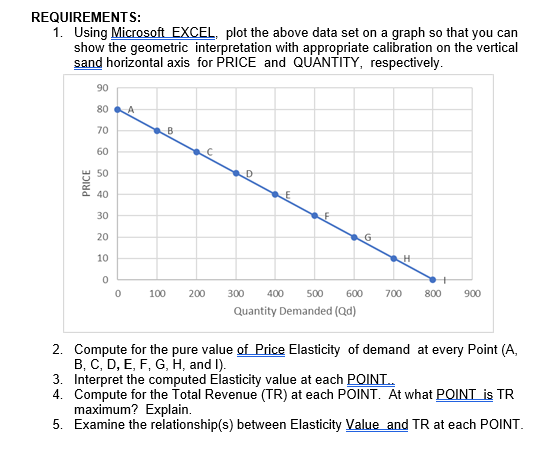
Transcribed Image Text:REQUIREMENTS:
1. Using Microsoft EXCEL, plot the above data set on a graph so that you can
show the geometric interpretation with appropriate calibration on the vertical
sand horizontal axis for PRICE and QUANTITY, respectively.
90
80
70
60
50
40
30
20
10
100
200
300
400
500
600
700
800
900
Quantity Demanded (Qd)
2. Compute for the pure value of Price Elasticity of demand at every Point (A,
B, C, D, E, F, G, H, and I).
3. Interpret the computed Elasticity value at each POINT.
4. Compute for the Total Revenue (TR) at each POINT. At what POINT is TR
maximum? Explain.
5. Examine the relationship(s) between Elasticity Value and TR at each POINT.
PRICE
Expert Solution
This question has been solved!
Explore an expertly crafted, step-by-step solution for a thorough understanding of key concepts.

This is a popular solution!

Trending now
This is a popular solution!

Step by step
Solved in 2 steps

Recommended textbooks for you


Economics (MindTap Course List)
Economics
ISBN:
9781337617383
Author:
Roger A. Arnold
Publisher:
Cengage Learning
