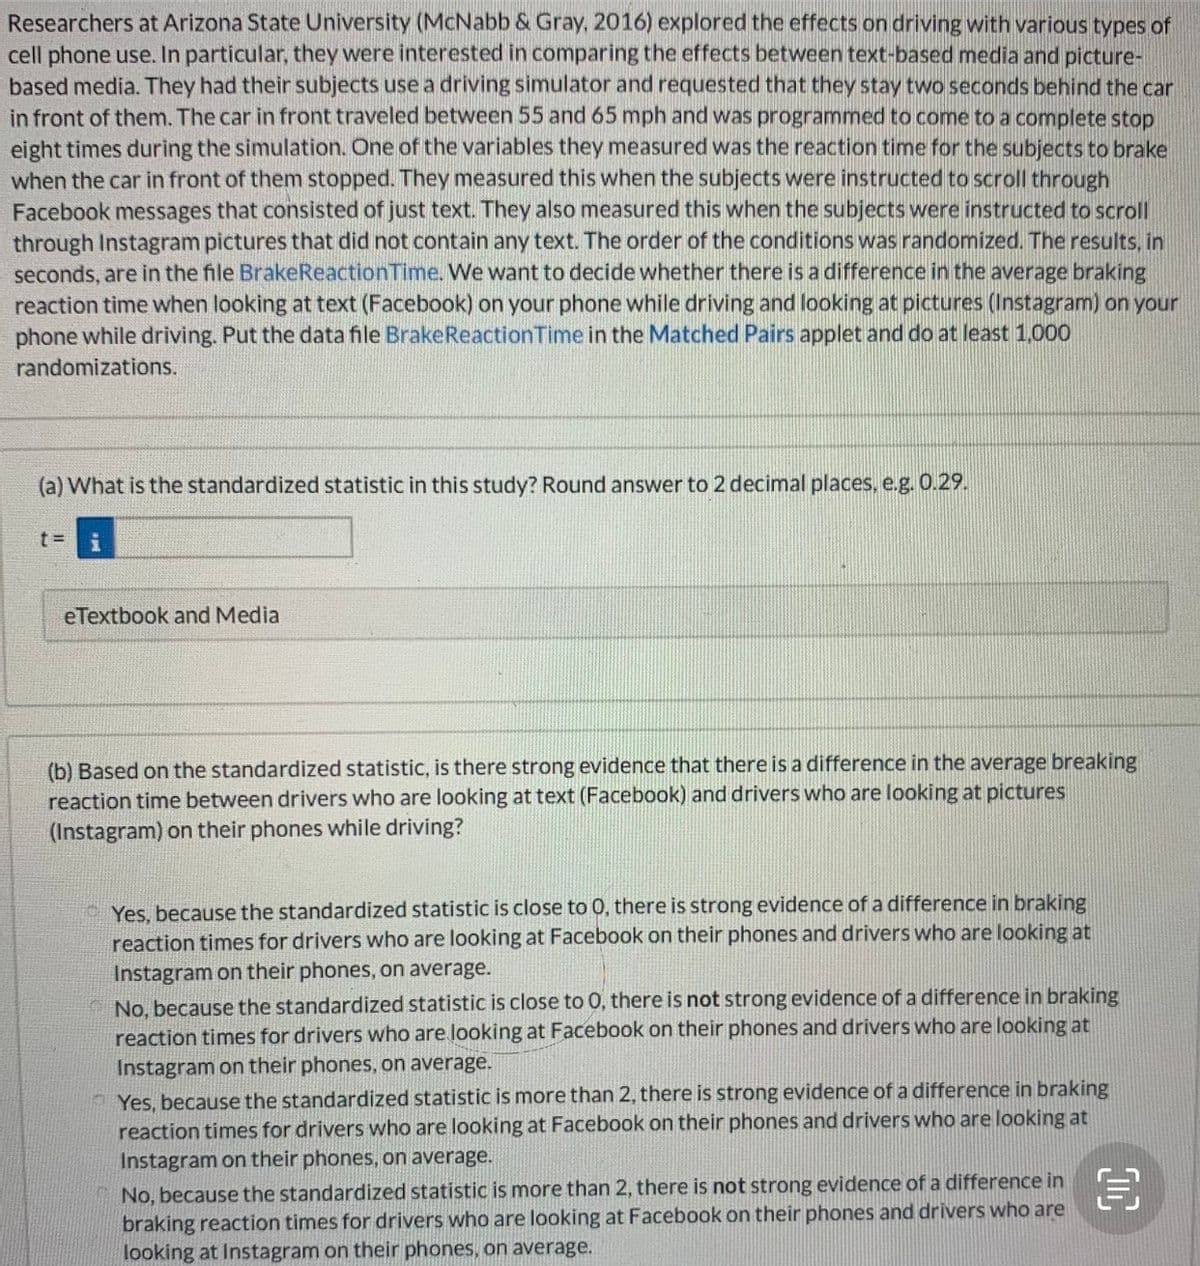
Researchers at Arizona State University (McNabb & Gray, 2016) explored the effects on driving with various types of cell phone use. In particular, they were interested in comparing the effects between text-based media and picture- based media. They had their subjects use a driving simulator and requested that they stay two seconds behind the car in front of them. The car in front traveled between 55 and 65 mph and was programmed to come to a complete stop eight times during the simulation. One of the variables they measured was the reaction time for the subjects to brake when the car in front of them stopped. They measured this when the subjects were instructed to scroll through Facebook messages that consisted of just text. They also measured this when the subjects were instructed to scroll through Instagram pictures that did not contain any text. The order of the conditions was randomized. The results, in seconds, are in the file BrakeReactionTime. We want to decide whether there is a difference in the average braking reaction time when looking at text (Facebook) on your phone while driving and looking at pictures (Instagram) on your phone while driving. Put the data file BrakeReactionTime in the Matched Pairs applet and do at least 1,000 randomizations. (a) What is the standardized statistic in this study? Round answer to 2 decimal places, e.g. 0.29. t=i eTextbook and Media
Researchers at Arizona State University (McNabb & Gray, 2016) explored the effects on driving with various types of cell phone use. In particular, they were interested in comparing the effects between text-based media and picture- based media. They had their subjects use a driving simulator and requested that they stay two seconds behind the car in front of them. The car in front traveled between 55 and 65 mph and was programmed to come to a complete stop eight times during the simulation. One of the variables they measured was the reaction time for the subjects to brake when the car in front of them stopped. They measured this when the subjects were instructed to scroll through Facebook messages that consisted of just text. They also measured this when the subjects were instructed to scroll through Instagram pictures that did not contain any text. The order of the conditions was randomized. The results, in seconds, are in the file BrakeReactionTime. We want to decide whether there is a difference in the average braking reaction time when looking at text (Facebook) on your phone while driving and looking at pictures (Instagram) on your phone while driving. Put the data file BrakeReactionTime in the Matched Pairs applet and do at least 1,000 randomizations. (a) What is the standardized statistic in this study? Round answer to 2 decimal places, e.g. 0.29. t=i eTextbook and Media

A First Course in Probability (10th Edition)
10th Edition
ISBN:9780134753119
Author:Sheldon Ross
Publisher:Sheldon Ross
Chapter1: Combinatorial Analysis
Section: Chapter Questions
Problem 1.1P: a. How many different 7-place license plates are possible if the first 2 places are for letters and...

Related questions
Question
100%
Parts A and B and data are in pictures uploaded
Transcribed Image Text:Researchers at Arizona State University (McNabb & Gray, 2016) explored the effects on driving with various types of
cell phone use. In particular, they were interested in comparing the effects between text-based media and picture-
based media. They had their subjects use a driving simulator and requested that they stay two seconds behind the car
in front of them. The car in front traveled between 55 and 65 mph and was programmed to come to a complete stop
eight times during the simulation. One of the variables they measured was the reaction time for the subjects to brake
when the car in front of them stopped. They measured this when the subjects were instructed to scroll through
Facebook messages that consisted of just text. They also measured this when the subjects were instructed to scroll
through Instagram pictures that did not contain any text. The order of the conditions was randomized. The results, in
seconds, are in the file BrakeReactionTime. We want to decide whether there is a difference in the average braking
reaction time when looking at text (Facebook) on your phone while driving and looking at pictures (Instagram) on your
phone while driving. Put the data file BrakeReactionTime in the Matched Pairs applet and do at least 1,000
randomizations.
(a) What is the standardized statistic in this study? Round answer to 2 decimal places, e.g. 0.29.
eTextbook and Media
(b) Based on the standardized statistic, is there strong evidence that there is a difference in the average breaking
reaction time between drivers who are looking at text (Facebook) and drivers who are looking at pictures
(Instagram) on their phones while driving?
Yes, because the standardized statistic is close to 0, there is strong evidence of a difference in braking
reaction times for drivers who are looking at Facebook on their phones and drivers who are looking at
Instagram on their phones, on average.
No, because the standardized statistic is close to 0, there is not strong evidence of a difference in braking
reaction times for drivers who are looking at Facebook on their phones and drivers who are looking at
Instagram on their phones, on average.
Yes, because the standardized statistic is more than 2, there is strong evidence of a difference in braking
reaction times for drivers who are looking at Facebook on their phones and drivers who are looking at
Instagram on their phones, on average.
No, because the standardized statistic is more than 2 , there is not strong evidence of a difference in
braking reaction times for drivers who are looking at Facebook on their phones and drivers who are
looking at Instagram on their phones, on average.
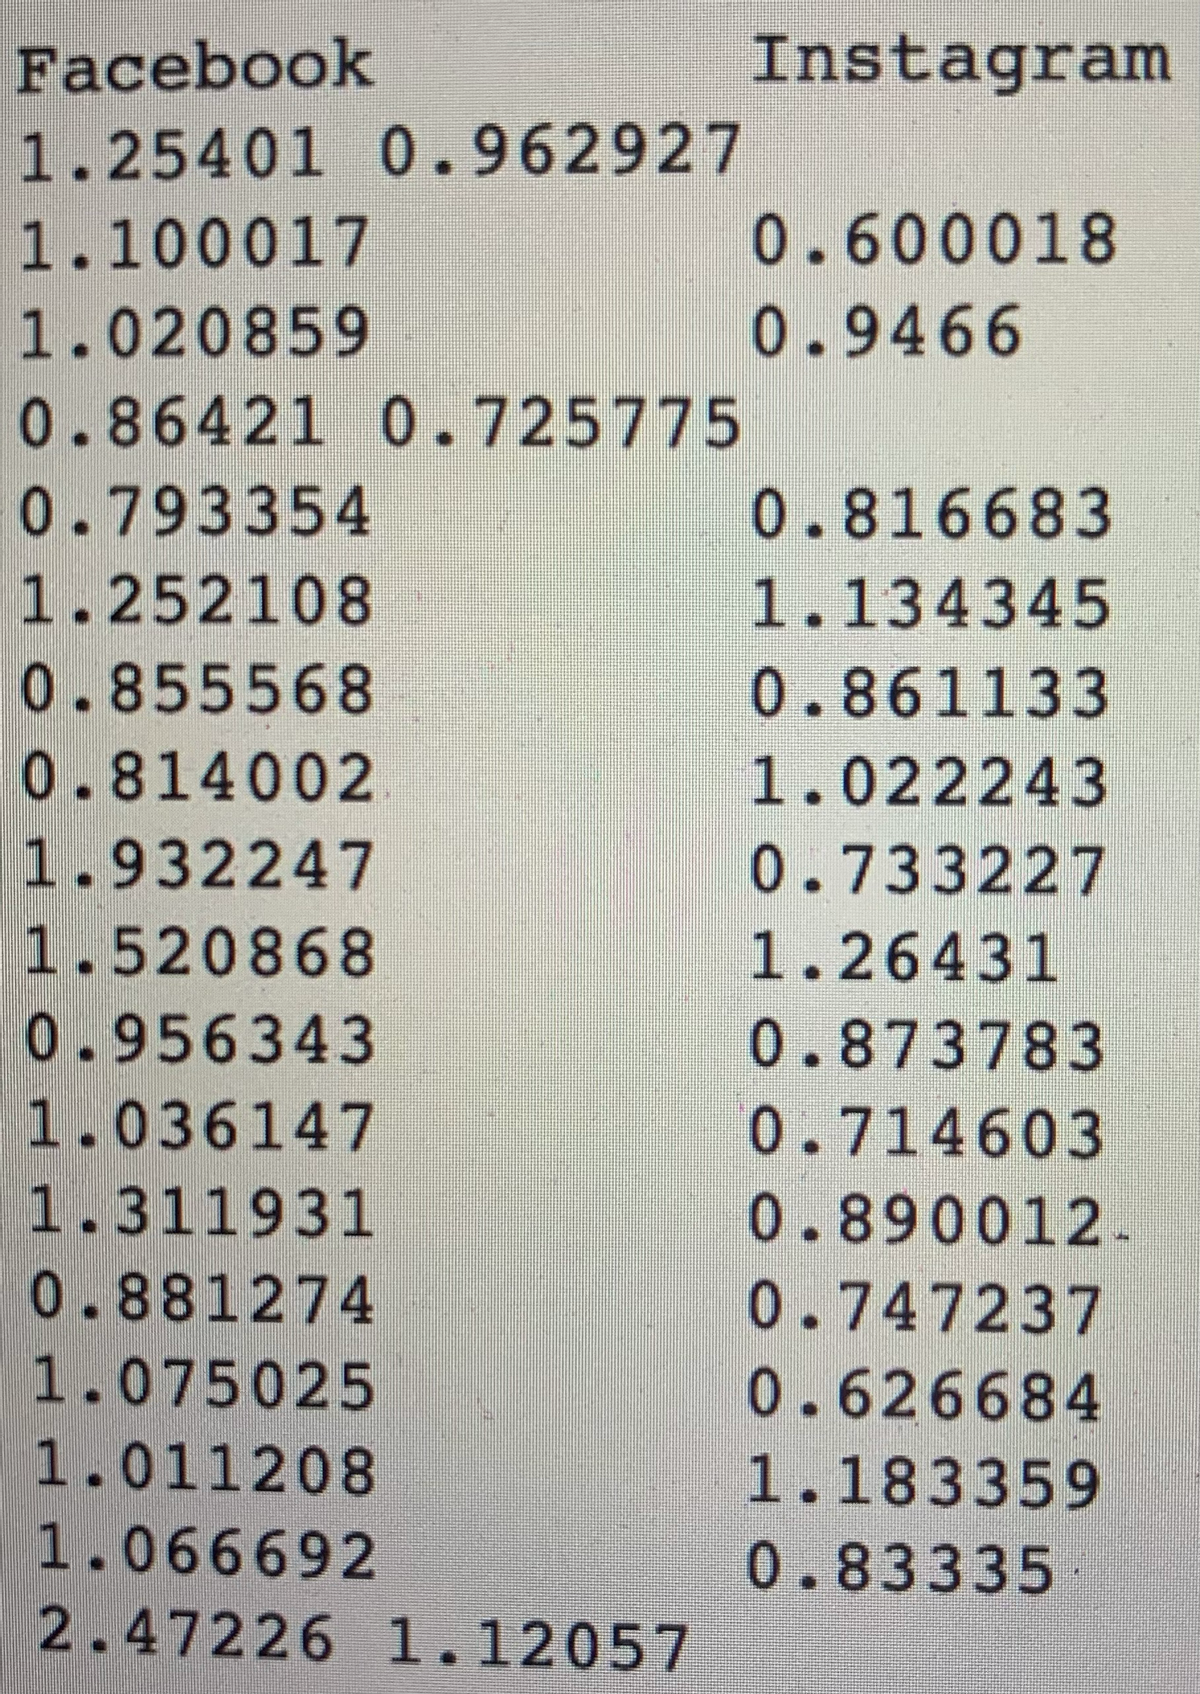
Transcribed Image Text:Facebook
Instagram
1.25401 0.962927
1.100017
0.600018
1.020859
0.9466
0.86421 0.725775
0.793354
0.816683
1.252108
1.134345
0.855568
0.861133
0.814002
1.022243
1.932247
0.733227
1.520868
1.26431
0.956343
0.873783
1.036147
0.714603
1.311931
0.890012.
0.881274
0.747237
1.075025
0.626684
1.011208
1.183359
1.066692
0.83335
2.47226 1.12057
Expert Solution
This question has been solved!
Explore an expertly crafted, step-by-step solution for a thorough understanding of key concepts.

This is a popular solution!

Trending now
This is a popular solution!

Step by step
Solved in 2 steps with 1 images

Recommended textbooks for you
A First Course in Probability (10th Edition)
Probability
ISBN:
9780134753119
Author:
Sheldon Ross
Publisher:
PEARSON

A First Course in Probability (10th Edition)
Probability
ISBN:
9780134753119
Author:
Sheldon Ross
Publisher:
PEARSON