Suzanne Zeedyk, a developmental psychologist at Dundee University's School of Psychology, conducted a pilot study in which parents started a half- hour walk with their infants in a parent-facing or an away-facing stroller and then switched to the other type of stroller midway. Her results suggest that parents talked less to the babies, the babies had higher heart rates, and they were less likely to fall asleep in away-facing strollers than in parent- facing strollers. You are interested in testing the hypothesis that babies who travel in parent-facing strollers have different expressive vocabularies than babies who travel in away-facing strollers. You randomly assign 12 newborns to parent-facing strollers and 12 newborns to away-facing strollers. You then test the babies' expressive vocabularies at age 18 months using the Expressive Vocabulary Test (EVT), which is designed primarily to assess children's expressive vocabulary. The sample means and sums of squares of the scores for each of the groups are presented in the following table. Group Away-facing Parent-facing Sample Mean Sum of Squares 98.1 2,064.59 106.2 1,404.59 You decide to use an ANOVA at a = 0.01 to test the null hypothesis that there is no difference between the groups. The ANOVA table follows. Calculate the F-ratio and enter it into the table. Source of Variation Between Treatments Within Treatments Total Sum of Squares 393.66 3,469.18 3,862.84 F Distribution Use the Distributions tool that follows to find Fertical at a significance level of a = 0.01, the value of F that bounds the critical region for the F-ratio test statistic. Numerator Degrees of Freedom-20 Denominator Degrees of Freedom-20 ANOVA Table Degrees of Freedom Mean Square F 1 22 23 0.00 5000 5000 1.00 1.000 2.00 393.66 157.69 3.00 4.00 5.00 6.00 7.00 8.00
Suzanne Zeedyk, a developmental psychologist at Dundee University's School of Psychology, conducted a pilot study in which parents started a half- hour walk with their infants in a parent-facing or an away-facing stroller and then switched to the other type of stroller midway. Her results suggest that parents talked less to the babies, the babies had higher heart rates, and they were less likely to fall asleep in away-facing strollers than in parent- facing strollers. You are interested in testing the hypothesis that babies who travel in parent-facing strollers have different expressive vocabularies than babies who travel in away-facing strollers. You randomly assign 12 newborns to parent-facing strollers and 12 newborns to away-facing strollers. You then test the babies' expressive vocabularies at age 18 months using the Expressive Vocabulary Test (EVT), which is designed primarily to assess children's expressive vocabulary. The sample means and sums of squares of the scores for each of the groups are presented in the following table. Group Away-facing Parent-facing Sample Mean Sum of Squares 98.1 2,064.59 106.2 1,404.59 You decide to use an ANOVA at a = 0.01 to test the null hypothesis that there is no difference between the groups. The ANOVA table follows. Calculate the F-ratio and enter it into the table. Source of Variation Between Treatments Within Treatments Total Sum of Squares 393.66 3,469.18 3,862.84 F Distribution Use the Distributions tool that follows to find Fertical at a significance level of a = 0.01, the value of F that bounds the critical region for the F-ratio test statistic. Numerator Degrees of Freedom-20 Denominator Degrees of Freedom-20 ANOVA Table Degrees of Freedom Mean Square F 1 22 23 0.00 5000 5000 1.00 1.000 2.00 393.66 157.69 3.00 4.00 5.00 6.00 7.00 8.00

MATLAB: An Introduction with Applications
6th Edition
ISBN:9781119256830
Author:Amos Gilat
Publisher:Amos Gilat
Chapter1: Starting With Matlab
Section: Chapter Questions
Problem 1P

Related questions
Question
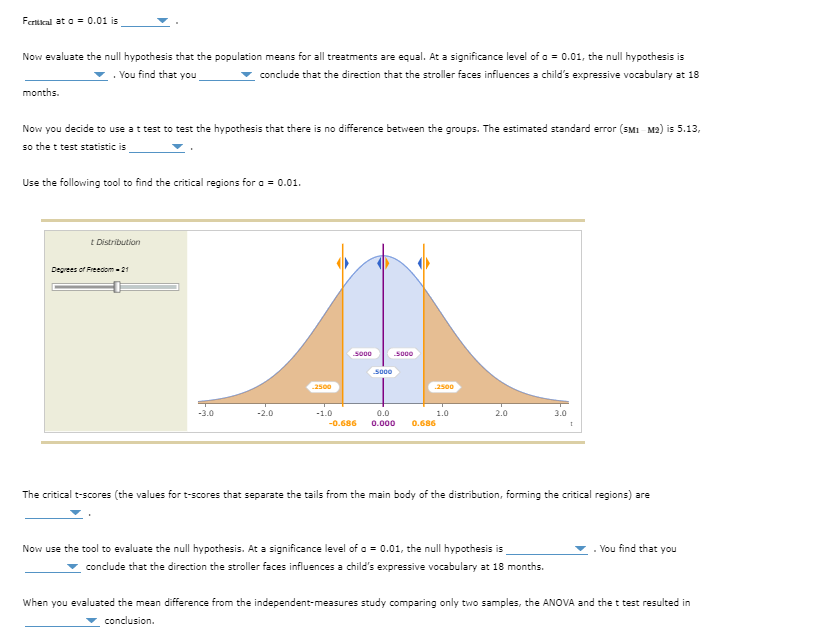
Transcribed Image Text:Fertical at a = 0.01 is
Now evaluate the null hypothesis that the population means for all treatments are equal. At a significance level of a = 0.01, the null hypothesis is
You find that you
conclude that the direction that the stroller faces influences a child's expressive vocabulary at 18
months.
Now you decide to use a t test to test the hypothesis that there is no difference between the groups. The estimated standard error (SM1 M2) is 5.13,
so the t test statistic is
Use the following tool to find the critical regions for a = 0.01.
t Distribution
Degrees of Freedom - 21
-3.0
-2.0
2500
-1.0
5000
5000
5000
0.0
-0.686 0.000 0.686
2500
1.0
2.0
3.0
Now use the tool to evaluate the null hypothesis. At a significance level of a = 0.01, the null hypothesis is
conclude that the direction the stroller faces influences a child's expressive vocabulary at 18 months.
1
The critical t-scores (the values for t-scores that separate the tails from the main body of the distribution, forming the critical regions) are
You find that you
When you evaluated the mean difference from the independent-measures study comparing only two samples, the ANOVA and the t test resulted in
conclusion.
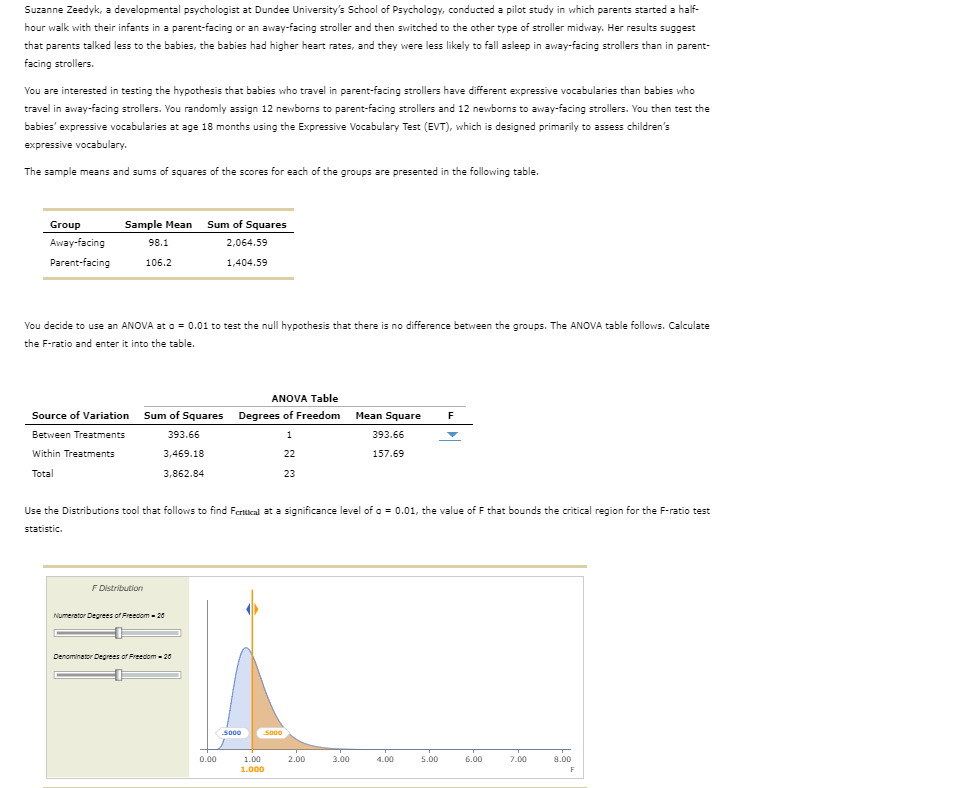
Transcribed Image Text:Suzanne Zeedyk, a developmental psychologist at Dundee University's School of Psychology, conducted a pilot study in which parents started a half-
hour walk with their infants in a parent-facing or an away-facing stroller and then switched to the other type of stroller midway. Her results suggest
that parents talked less to the babies, the babies had higher heart rates, and they were less likely to fall asleep in away-facing strollers than in parent-
facing strollers.
You are interested in testing the hypothesis that babies who travel in parent-facing strollers have different expressive vocabularies than babies who
travel in away-facing strollers. You randomly assign 12 newborns to parent-facing strollers and 12 newborns to away-facing strollers. You then test the
babies' expressive vocabularies at age 18 months using the Expressive Vocabulary Test (EVT), which is designed primarily to assess children's
expressive vocabulary.
The sample means and sums of squares of the scores for each of the groups are presented in the following table.
Group
Away-facing
Parent-facing
Sample Mean Sum of Squares
2,064.59
1,404.59
You decide to use an ANOVA at a = 0.01 to test the null hypothesis that there is no difference between the groups. The ANOVA table follows. Calculate
the F-ratio and enter it into the table.
Source of Variation
Between Treatments
Within Treatments
Total
98.1
106.2
F Distribution
Sum of Squares
393.66
3,469.18
3,862.84
Use the Distributions tool that follows to find Feritical at a significance level of a = 0.01, the value of F that bounds the critical region for the F-ratio test
statistic.
Numerator Degrees of Freedom-20
0
Denominator Degrees of Freedom-20
0
ANOVA Table
Degrees of Freedom
1
22
23
0.00
5000
1.00
1.000
5000
2.00
Mean Square F
393.66
157.69
3.00
4.00
5.00
6.00
7.00
8.00
F
Expert Solution
This question has been solved!
Explore an expertly crafted, step-by-step solution for a thorough understanding of key concepts.

This is a popular solution!

Trending now
This is a popular solution!

Step by step
Solved in 3 steps

Recommended textbooks for you
MATLAB: An Introduction with Applications
Statistics
ISBN:
9781119256830
Author:
Amos Gilat
Publisher:
John Wiley & Sons Inc

Probability and Statistics for Engineering and th…
Statistics
ISBN:
9781305251809
Author:
Jay L. Devore
Publisher:
Cengage Learning

Statistics for The Behavioral Sciences (MindTap C…
Statistics
ISBN:
9781305504912
Author:
Frederick J Gravetter, Larry B. Wallnau
Publisher:
Cengage Learning
MATLAB: An Introduction with Applications
Statistics
ISBN:
9781119256830
Author:
Amos Gilat
Publisher:
John Wiley & Sons Inc
Probability and Statistics for Engineering and th…
Statistics
ISBN:
9781305251809
Author:
Jay L. Devore
Publisher:
Cengage Learning
Statistics for The Behavioral Sciences (MindTap C…
Statistics
ISBN:
9781305504912
Author:
Frederick J Gravetter, Larry B. Wallnau
Publisher:
Cengage Learning

Elementary Statistics: Picturing the World (7th E…
Statistics
ISBN:
9780134683416
Author:
Ron Larson, Betsy Farber
Publisher:
PEARSON

The Basic Practice of Statistics
Statistics
ISBN:
9781319042578
Author:
David S. Moore, William I. Notz, Michael A. Fligner
Publisher:
W. H. Freeman

Introduction to the Practice of Statistics
Statistics
ISBN:
9781319013387
Author:
David S. Moore, George P. McCabe, Bruce A. Craig
Publisher:
W. H. Freeman