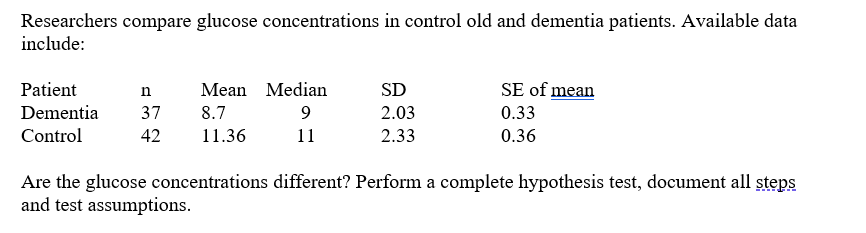
Researchers compare glucose concentrations in control old and dementia patients. Available data include: Patient n Dementia 37 8.7 Control 42 11.36 Mean Median 9 11 SD 2.03 2.33 SE of mean 0.33 0.36 Are the glucose concentrations different? Perform a complete hypothesis test, document all steps and test assumptions.


Q: Let A and B be sets, where: A = {0, 3, 5} B=0 Write AU B: Write An B: Enter your answer using proper…
A: A & B be two sets, A={0,3,5} B=∅
Q: Let's say you survey a random sample of 70 people. You ask the people in your survey if they prefer…
A: given data n = 70 p = 0.53 95% ci for p margin of error (E) = ?
Q: What is the difference between quantitative and qualitative data?
A: Numbers, counts, or measurements make up quantitative data. Qualitative data is dependent on…
Q: One type of card stock which may be used for the cover of a booklet is uncoated paper with weight…
A: Here the Given information is One type of card stock which may be used for the cover of a booklet is…
Q: According to Lyme Disease surveillance information from the Rhode Island Department of Health…
A: From the given information, the number of Lyme disease cases in Providence county is, 441. The…
Q: a combination lock uses three numbers between 1 and 35 with repetition, and they must be selected…
A: We have given information, A combination lock uses three numbers between 1 and 35 with repetition,…
Q: 3. Let X be a random sample from N(,02). Find MLEs for and ².
A: The objective of this question is to find the maximum likelihood estimators (MLE) of the population…
Q: 1. The following histogram shows the distribution of medical expenditures (in U.S. dollars in the…
A: “Since you have asked multiple questions, we will solve the first question for you. If you want any…
Q: The image contains two graphs typical of the analysis of a simple linear regression model. It can be…
A: The above question discusses the results of a linear regression model, as represented by two graphs.…
Q: ou apply it? why do you apply it?
A: Correction Factor: This factor is applied when there is a change or it is deviating from the…
Q: The data in the table below presents the hourly quantity of production for three lines of production…
A: The given data is: Day Process 1 Process 2 Process 3 1 33 33 28 2 30 35 36 3 28 30 30 4…
Q: Compare the mean, median, and mode in terms of their sensitivity to extreme scores
A: The question is about measures Introduction : Extreme scores : The score or observation which is far…
Q: Calculate and interpret a 95% confidence interval to estimate the true proportion of California…
A: Given information X=360, n=600
Q: A binomial experiment has the given number of trials and the given success probability p. n=2, p=0.2…
A: given data binomial experiment p=0.20n=2q=1-p=1-0.20=0.80we have to find out the given probability…
Q: A random sample of 25 professional basketball players shows a mean height of 6 feet, 5 inches with a…
A: Given problem Given that A random sample of 25 professional basketball players shows a mean…
Q: If you pulled a z-score randomly from a standard normal distribution, which of the following scores…
A:
Q: With a normal curve, the probability of a score occurring above the mean is _____. a.) 0 b.) 0.5…
A: GivenThe probability of score occurring above the mean
Q: In 2014, 2.756 billion dollars of e-cigarettes were sold worldwide. Fill in the table with the 2014…
A: part-3: a) since 2010 lies between 2008-2011, so it is: Interpolating. b) To predict worldwide sales…
Q: following table shows one runner's finish times (given in minutes) for eight different 5K races.…
A: Given that data 25.95 26.5 24.53 28.53 25.02 27.73 26.85 25.58
Q: Sherry is a production manager for a small manufacturing shop and is interested in developing a…
A: Note:“Since you have posted a question with multiple sub parts, we willprovide the solution only to…
Q: Using the following values: sum squared of deviations on variable X equals 250, sum squared of…
A: To estimate the coefficients of the regression equation, we can use the formula: b1 = sum of product…
Q: Two independent methods of forecasting based on judgment and experience have been prepared each…
A: Solution: From the given information,
Q: The makers of Aspro brand aspirin want to be sure that their tablets contain the righ amount of…
A:
Q: Let's say you survey a random sample of people. You find that 53% prefer apples over oranges. You…
A: given data p^ = 0.5390% ci for p is : (0.448,0.612)based on this ci we have to find the given…
Q: Download the dataset "HT_3341.xls" and conduct a two-sample t-test using Excel. (You can find the…
A: Given data set:
Q: Researchers watched groups of dolphins to determine what activities the dolphins partake in at…
A:
Q: (a) Find (71-72) answer: (b) Determine the rejection region for the test of Ho: (1-2)=2.46 and Ha:…
A: Given that, Population 1 Population 2 n1=88 n2=72 x¯1=6.7 x¯2=9.6 s12= 39 s22 = 33 The…
Q: Researchers measured the data speeds for a particular smartphone carrier at 50 airports. The highest…
A: The no. of considered airports, n=50. The highest measured data speed is 71.9 Mbps. For the…
Q: A time series contains 10 observations. What is the probability that the number of runs is a. fewer…
A: To answer this question, we need to define what is meant by "runs". A run is a sequence of…
Q: 30. Expected Value in North Carolina's Pick 4 Game In North Carolina's Pick 4 lottery game, you can…
A: Given Information: You can pay $1 to select a four-digit number from 0000 through 9999. If you…
Q: student is preparing to take a standardized exam. She was told that she needs to get plenty of sleep…
A: Data is given for Amount of Sleep (hours) and score First we will calculate regression equation .…
Q: A researcher wishes to conduct a study of the color preferences of new car buyers. Suppose that 30%…
A: Given that, The random variable X is the color preferences of new car buyers. 30% population prefers…
Q: Are Transformations Necessary? Which of the following are correct reasons for transforming data? (a)…
A: Data transformation is a method that is used to restructure the data so that analysis can be done on…
Q: Then, we can compute P[Y > 5] in terms of the standard Gaussian CDF Þ(x) as P[Y > 5] = 1 – Þ(a) for…
A: “Since you have asked multiple questions, we will solve the first question for you. If you want any…
Q: Use Bayes' theorem to solve this problem. A storeowner purchases stereos from two companies. From…
A: 650 stereos are purchased form company A 950 stereos are purchased from company B…
Q: A group maintains a database of the number, source, and location of oil sp navigable and territorial…
A: Answer:- Given probability data table is Using rule:- Special addition rule P( A or B ) = P(A) +…
Q: A manufacturer knows that their items have a lengths that are skewed right, with a mean of 12.6…
A:
Q: Suppose that the New England Colonials baseball team is equally likely to win a game as not to win…
A: The question is about discrete prob. distribution Given : Colonial baseball team is eq. likely to…
Q: If two people used the same data and one person made a 90% confidence interval and the other person…
A: Given: Two people used the same data and one person made a 90% confidence interval and the other…
Q: It snows in Greenland an average of once every 25 days, and when it does snow, glaciers have a 20%…
A: a) There is snow once in every 25 days in Greenland.
Q: You wish to test the following claim (Ha) at a significance level of a = 0.05. H₁: p=0.4 H₁: p <0.4…
A: From the provided information, The hypotheses are as follow: H0: p = 0.4 Ha: p < 0.4 Sample size…
Q: There is a mean of .00473 asteroid impacts on the earth (for asteroids in a certain size class with…
A: Given Information : Mean no. of asteroid impacts on the earth per year ( λ ) = 0.00473 Total no. of…
Q: Sick computers: Let V be the event that a computer contains a virus, and let W be the event that a…
A: Given that: Probability of event V is, PV=0.43. Probability of event W is, PW=0.09 Probability of…
Q: Highway TPH Data. Estimate the 95th percentile and its upper 95% confidence limit for the highway…
A: The given data of TPH is shown below 19 119 40 129 48 114 23 92 79 43 19 62 118 230…
Q: True or False and explain if false: 1. The slope estimate from a regression model is an example of…
A: Descriptive statistics : Brief information about the coefficients that give a summary about the…
Q: General multiplication rule as applied to events A and B: A) used to calculate probabilities of…
A: The general multiplication rule can be used to calculate the probability of any combination of…
Q: High blood pressure: A national survey reported that 34% of adults in a certain country have…
A: given data P9hypertension) = p = 0.34saample size (n) = 24x = no. of people with hypertension
Q: 3. At a carnival, there is a single player game called the High Striker. Here is how the game works:…
A: To determine the expected number of swings taken by a randomly chosen player while playing the game,…
Q: Step 1. Test Set-up The Dean of Students at Nunya Business College claims that by the time of…
A: This question aims to determine whether the survey data collected by the student government at the…
Q: Defective components: A lot of 11 components contains 3 that are defective. Two components are…
A: Given that, Total number of components N=11 The defective components are 3 Two components are drawn…
Glucose tolerance test
Given
The data is as follows:
| Patient | n | Mean | Median | SD | SE of mean |
| Dementia (Sample 1) | 37 | 8.7 | 9 | 2.03 | 0.33 |
| Control (Sample 2) | 42 | 11.36 | 11 | 2.33 | 0.36 |
Assuming as it is the general value.

Trending now
This is a popular solution!

Step by step
Solved in 2 steps with 1 images

- Do sit down restaurant franchises and fast food franchises differ significantly in stock price? Specifically, is the average stock price for sit-down restaurants different from the average stock price for fast food restaurants? A hypothesis test for two independent samples is run on data recorded from the stock exchange and a p-value is calculated to be 0.044. What is the appropriate conclusion?Analyze the relationship between respondents’ marital status (MARITAL) and whether they believe it is alright for a couple to live together without intending to get married (COHABOK) using crosstabulation. Which marital status category is most disapproving of nonmarital cohabitation? Which marital status category is most approving of nonmarital cohabitation? Is the relationship between marital status and attitude toward nonmarital cohabitation statistically significant at the .05 level? Compute and interpret an appropriate measure of association for this relationship. Most disapprove: married – 54.9% Most approve: tied married + never married – 35.3% Difference: 19.6% Significance level: can you find the significance level?Report an appropriate hypothesis test for a positive linear relationship and use a 5% significance level. Which of the following is the correct P-value picture?
- Based on statistical analysis, are we justified in asserting that two variables are statistically dependent? Why or why not? Explain why researchers typically focus on statistical independence rather than statistical dependence.Select a significance level α and reject the null-hypothesis if the p-value is less than α. Explain, in complete sentences, your findings: Is there a statistically significant association (at α level) between the provided genes? What is the magnitude and the direction of the association?If you are conducting a study on the academic performance of students who are registered members of any of the university's sports and cultural clubs. A colleague has suggested that it is better for you to utilise secondary data for your study. Do you agree with her suggestion? Justify your response
- Using SPSS, analyze the relationship between respondents’ marital status (MARITAL) and whether they believe it is alright for a couple to live together without intending to get married (COHABOK) using crosstabulation. Which marital status category is most disapproving of nonmarital cohabitation? Which marital status category is most approving of nonmarital cohabitation? Is the relationship between marital status and attitude toward nonmarital cohabitation statistically significant at the .05 level? Compute and interpret an appropriate measure of association for this relationship.wild bears were anesthetized, and then their weights and chest sizes were measured and listed in a data set. Results are shown in the accompanying display. Is there sufficient evidence to support the claim that there is a linear correlation between the weights of bears and their chest sizes? When measuring an anesthetized bear, is it easier to measure chest size than weight? If so, does it appear that a measured chest size can be used to predict the weight? Use a significance level of α=0.05. Correlation Results Correlation coeff, r: 0.978552 Critical r: ±0.2680855 P-value (two tailed): 0.000Would a chi-square test be the best statistical analysis if I testing a hypothesis that single mothers experience more parent burnout than single fathers due to lack of support and unregulated emotions? my variables are : lack of support, unregulated emotions, socioeconomic status, addiction, and parenting education.
- What is H0 for a one-way ANOVA? If H0 is rejected, does that imply that each mean is significantly different from every other mean? What information do you need to decide on a sample size that will provide adequate statistical power? If there is an overall significant F in a one-way ANOVA, can we conclude that the group membership or treatment variable caused the observed differences in the group means? Why or why not?Formulate hypotheses about the two population variances that can be used to determine ifthe population variance in battery hours of use is greater for the talk time application.b. What are the standard deviations of battery hours of use for the two samples?c. Conduct the hypothesis test and compute the p-value. Using a 0.05 level of significance,what is your conclusion?What does it mean for a correlation coefficient to have a p < .02 significance level?