Researchers were interested in the number of outdoor walks a week that people had taken during the COVID-19 lock down based on the neighborhood that they lived in. People were recruited from Midtown Toronto, Markham, and Maple. Researchers justified the different neighborhoods based on congestion and outdoor spaces. The researchers wanted to see if there was a signficiant difference between the number of outdoor walks a week based on neighborhood. Here is the data that they collected Midtown Toronto: 1 3 4 2 4 Markam: 4 3 45 Maple: 10 7 69 8 Test the hypothesis at the 5% significance level (a = 0.05) using the 5-step hypothesis testing procedure (show ALL steps). Make sure to clearly state the null and alternative hypotheses in formal notation. Round all values to 2 decimal places. Show your work. You are encouraged to use this table to help you with your calculations. Take a picture of your work and upload the file as either a Word doc, PDF or JPEG. Do NOT upload HEIC or Pages files. SS df MS F-statistic Between/Treatments Within/Error Total Attach File Browse Local Files Browse Content Collection
Researchers were interested in the number of outdoor walks a week that people had taken during the COVID-19 lock down based on the neighborhood that they lived in. People were recruited from Midtown Toronto, Markham, and Maple. Researchers justified the different neighborhoods based on congestion and outdoor spaces. The researchers wanted to see if there was a signficiant difference between the number of outdoor walks a week based on neighborhood. Here is the data that they collected Midtown Toronto: 1 3 4 2 4 Markam: 4 3 45 Maple: 10 7 69 8 Test the hypothesis at the 5% significance level (a = 0.05) using the 5-step hypothesis testing procedure (show ALL steps). Make sure to clearly state the null and alternative hypotheses in formal notation. Round all values to 2 decimal places. Show your work. You are encouraged to use this table to help you with your calculations. Take a picture of your work and upload the file as either a Word doc, PDF or JPEG. Do NOT upload HEIC or Pages files. SS df MS F-statistic Between/Treatments Within/Error Total Attach File Browse Local Files Browse Content Collection

Algebra: Structure And Method, Book 1
(REV)00th Edition
ISBN:9780395977224
Author:Richard G. Brown, Mary P. Dolciani, Robert H. Sorgenfrey, William L. Cole
Publisher:Richard G. Brown, Mary P. Dolciani, Robert H. Sorgenfrey, William L. Cole
Chapter2: Working With Real Numbers
Section2.3: Rules For Addition
Problem 7P

Related questions
Question
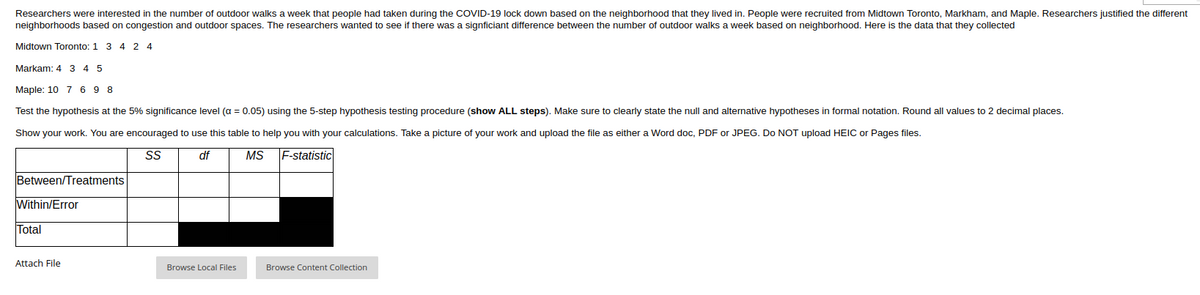
Transcribed Image Text:Researchers were interested in the number of outdoor walks
week that people had taken during the COVID-19 lock down based on the neighborhood that they lived in. People were recruited from Midtown Toronto, Markham, and Maple. Researchers justified the different
neighborhoods based on congestion and outdoor spaces. The researchers wanted to see if there was a signficiant difference between the number of outdoor walks a week based on neighborhood. Here i
s the data that they collected
Midtown Toronto: 1 3 4 2 4
Markam: 4 3 4 5
Maple: 10 7 6 9 8
Test the hypothesis at the 5% significance level (a = 0.05) using the 5-step hypothesis testing procedure (show ALL steps). Make sure to clearly state the null and alternative hypotheses in formal notation. Round all values to 2 decimal places.
Show your work. You are encouraged to use this table to help you with your calculations. Take a picture of your work and upload the file as either a Word doc, PDF or JPEG. Do NOT upload HEIC or Pages files.
SS
df
MS
F-statistic
Between/Treatments
Within/Error
Total
Attach File
Browse Local Files
Browse Content Collection
Expert Solution
This question has been solved!
Explore an expertly crafted, step-by-step solution for a thorough understanding of key concepts.

Step by step
Solved in 3 steps with 2 images

Recommended textbooks for you
Algebra: Structure And Method, Book 1
Algebra
ISBN:
9780395977224
Author:
Richard G. Brown, Mary P. Dolciani, Robert H. Sorgenfrey, William L. Cole
Publisher:
McDougal Littell
Algebra: Structure And Method, Book 1
Algebra
ISBN:
9780395977224
Author:
Richard G. Brown, Mary P. Dolciani, Robert H. Sorgenfrey, William L. Cole
Publisher:
McDougal Littell