ression analysis), an analyst produced the price-demand function p(x) = 2,000 - 40x, 15xs25 to model the data. Complete parts (A) and pelow. 6 176 16 136 21 116 25 100 Plot the data points in the table, and sketch a graph of the price-demand ction in the same coordinate system. O A. О В. Ap(x) Ap(x) pose the correct graph to the right. 1920 1920
ression analysis), an analyst produced the price-demand function p(x) = 2,000 - 40x, 15xs25 to model the data. Complete parts (A) and pelow. 6 176 16 136 21 116 25 100 Plot the data points in the table, and sketch a graph of the price-demand ction in the same coordinate system. O A. О В. Ap(x) Ap(x) pose the correct graph to the right. 1920 1920

Algebra & Trigonometry with Analytic Geometry
13th Edition
ISBN:9781133382119
Author:Swokowski
Publisher:Swokowski
Chapter7: Analytic Trigonometry
Section7.6: The Inverse Trigonometric Functions
Problem 91E

Related questions
Question
28a
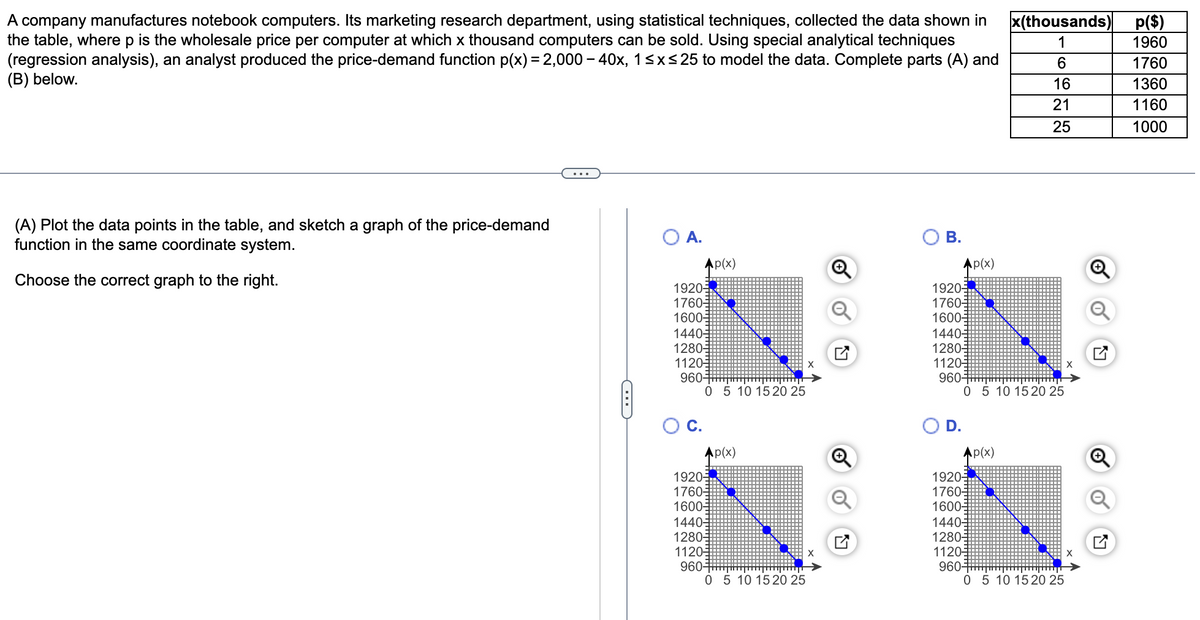
Transcribed Image Text:A company manufactures notebook computers. Its marketing research department, using statistical techniques, collected the data shown in
the table, where p is the wholesale price per computer at which x thousand computers can be sold. Using special analytical techniques
(regression analysis), an analyst produced the price-demand function p(x) = 2,000 – 40x, 1<x<25 to model the data. Complete parts (A) and
(В) below.
x(thousands)
p($)
1960
1
1760
16
1360
21
1160
25
1000
(A) Plot the data points in the table, and sketch a graph of the price-demand
function in the same coordinate system.
OA.
В.
Ap(x)
Ap(x)
Choose the correct graph to the right.
1920
1760
1600-
1440-
1280-
1120
960-
0 5 10 1520 25
1920
1760
1600
1440-
1280
1120
960-
0 5 10 1520 25
С.
D.
Ap(x)
Ap(x)
1920
1760
1600
1440=
1280
1120
960
0 5 10 1520 25
1920
17605
1600
1440-
12805
1120
960-
05 10 1520 25
Expert Solution
This question has been solved!
Explore an expertly crafted, step-by-step solution for a thorough understanding of key concepts.

This is a popular solution!

Trending now
This is a popular solution!

Step by step
Solved in 2 steps

Follow-up Questions
Read through expert solutions to related follow-up questions below.
Follow-up Question
28. please answer b

Transcribed Image Text:A company manufactures notebook computers. Its marketing research department, using statistical techniques, collected the data shown in
the table, where p is the wholesale price per computer at which x thousand computers can be sold. Using special analytical techniques
(regression analysis), an analyst produced the price-demand function p(x) = 2,000 – 40x, 1<xs 25 to model the data. Complete parts (A) and
(B) below.
x(thousands)
p($)
1
1960
6.
1760
16
1360
21
1160
25
1000
(A) Plot the data points in the table, and sketch a graph of the price-demand
function in the same coordinate system.
O A.
В.
Ap(x)
Ap(x)
Choose the correct graph to the right.
1920
1760
1600
1440-
1280-
1120-
960-
0 5 10 1520 25
1920
17603
1600-
1440-
1280
1120
960-
0 5 10 1520 25
(B) What would be the estimated price per computer for a demand of 11,000
computers? For a demand of 20,000 computers?
The estimated price per computer for a demand of 11,000 computers is $
D.
Ap(x)
Ap(x)
1920
1760
1600=
1920-
1760
1600-
1440=
1280-
1120
960-
O 5 10 1520 25
1440-
1280
1120-
960-
0 5 10 1520 25
Solution
Recommended textbooks for you
Algebra & Trigonometry with Analytic Geometry
Algebra
ISBN:
9781133382119
Author:
Swokowski
Publisher:
Cengage

College Algebra (MindTap Course List)
Algebra
ISBN:
9781305652231
Author:
R. David Gustafson, Jeff Hughes
Publisher:
Cengage Learning

Algebra and Trigonometry (MindTap Course List)
Algebra
ISBN:
9781305071742
Author:
James Stewart, Lothar Redlin, Saleem Watson
Publisher:
Cengage Learning
Algebra & Trigonometry with Analytic Geometry
Algebra
ISBN:
9781133382119
Author:
Swokowski
Publisher:
Cengage
College Algebra (MindTap Course List)
Algebra
ISBN:
9781305652231
Author:
R. David Gustafson, Jeff Hughes
Publisher:
Cengage Learning
Algebra and Trigonometry (MindTap Course List)
Algebra
ISBN:
9781305071742
Author:
James Stewart, Lothar Redlin, Saleem Watson
Publisher:
Cengage Learning

Algebra: Structure And Method, Book 1
Algebra
ISBN:
9780395977224
Author:
Richard G. Brown, Mary P. Dolciani, Robert H. Sorgenfrey, William L. Cole
Publisher:
McDougal Littell