ROP With Variable Demand and Lead Time Data Risk of Stock Out Assume the maximum risk of stock out we wish to take is 1%. What is the ROP? Average demand per week = 200 Stdv of demand per week = 50 Average lead time in weeks = 3 Stdv of lead time in weeks = 2 Service level: 95% Safety stock will become: Lead time and demand are normally distributed New ROP = ROP With Variability Service level 90% 95% 99% 99.9% Note: 1 Service level = stockout risk Key Z-Values Z-value 1.28 1.65 2.33 3.08
ROP With Variable Demand and Lead Time Data Risk of Stock Out Assume the maximum risk of stock out we wish to take is 1%. What is the ROP? Average demand per week = 200 Stdv of demand per week = 50 Average lead time in weeks = 3 Stdv of lead time in weeks = 2 Service level: 95% Safety stock will become: Lead time and demand are normally distributed New ROP = ROP With Variability Service level 90% 95% 99% 99.9% Note: 1 Service level = stockout risk Key Z-Values Z-value 1.28 1.65 2.33 3.08

Practical Management Science
6th Edition
ISBN:9781337406659
Author:WINSTON, Wayne L.
Publisher:WINSTON, Wayne L.
Chapter10: Introduction To Simulation Modeling
Section10.4: Simulation With Built-in Excel Tools
Problem 13P

Related questions
Question
Please solve correctly in 1 hour and get the thumbs up please show neat and clean work please provide correct solution
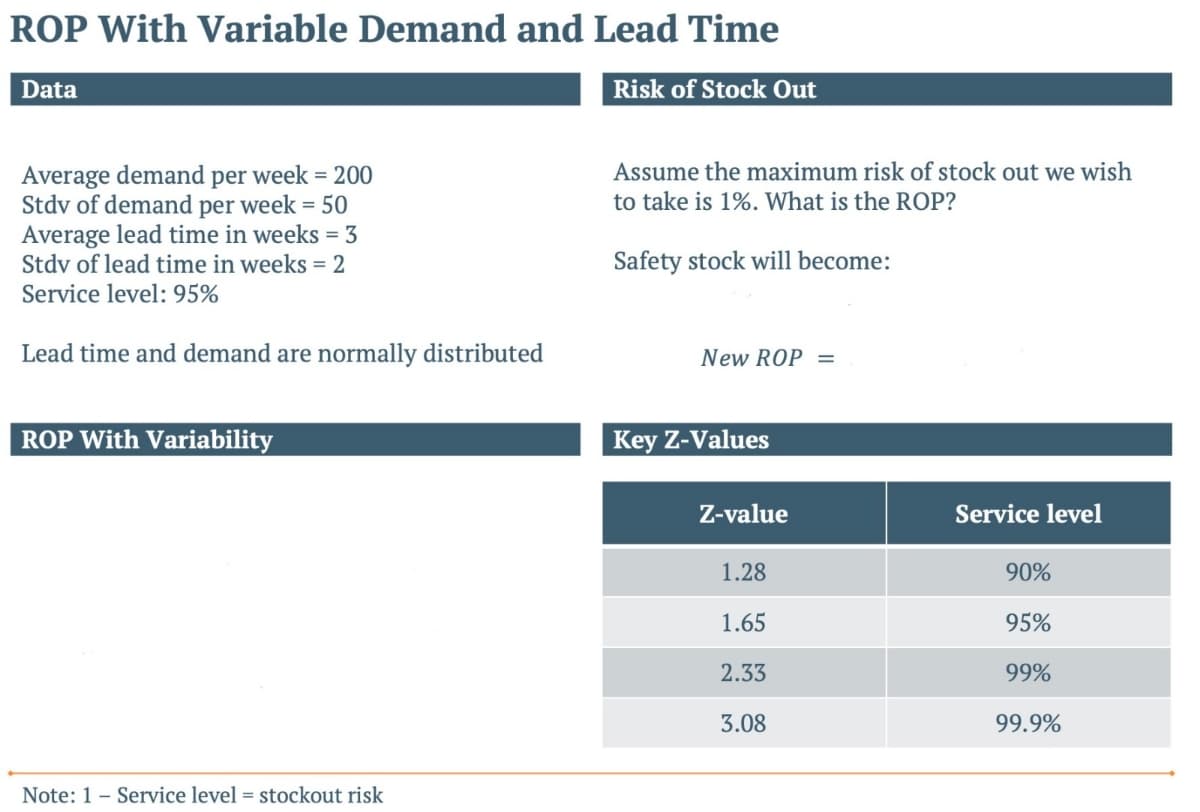
Transcribed Image Text:ROP With Variable Demand and Lead Time
Data
Risk of Stock Out
Assume the maximum risk of stock out we wish
to take is 1%. What is the ROP?
Average demand per week = 200
Stdv of demand per week = 50
Average lead time in weeks = 3
Stdv of lead time in weeks = 2
Service level: 95%
Safety stock will become:
Lead time and demand are normally distributed
New ROP =
ROP With Variability
Service level
90%
95%
99%
99.9%
Note: 1 Service level = stockout risk
Key Z-Values
Z-value
1.28
1.65
2.33
3.08
![LP Center of Gravity
Data
Location
X
Y
Cost
1
7
4
13
2
1
14
5
3
9
3
15
4
4
9
24
Total
21
30
57
Simplification
Create an LP to find the optimal locations of the two centers by making sure the transportation cost is
minimized. To simplify your task, assume that the centers can only be placed in a range from [5,4] to
[7,7].](/v2/_next/image?url=https%3A%2F%2Fcontent.bartleby.com%2Fqna-images%2Fquestion%2Ffe3ef870-538f-47ff-b117-25fb75317347%2F6cb1c2fb-2b6d-4f26-9cf6-204f7d1f102a%2Frekiy3i_processed.jpeg&w=3840&q=75)
Transcribed Image Text:LP Center of Gravity
Data
Location
X
Y
Cost
1
7
4
13
2
1
14
5
3
9
3
15
4
4
9
24
Total
21
30
57
Simplification
Create an LP to find the optimal locations of the two centers by making sure the transportation cost is
minimized. To simplify your task, assume that the centers can only be placed in a range from [5,4] to
[7,7].
Expert Solution
This question has been solved!
Explore an expertly crafted, step-by-step solution for a thorough understanding of key concepts.

Step by step
Solved in 2 steps with 3 images

Recommended textbooks for you
Practical Management Science
Operations Management
ISBN:
9781337406659
Author:
WINSTON, Wayne L.
Publisher:
Cengage,
Practical Management Science
Operations Management
ISBN:
9781337406659
Author:
WINSTON, Wayne L.
Publisher:
Cengage,