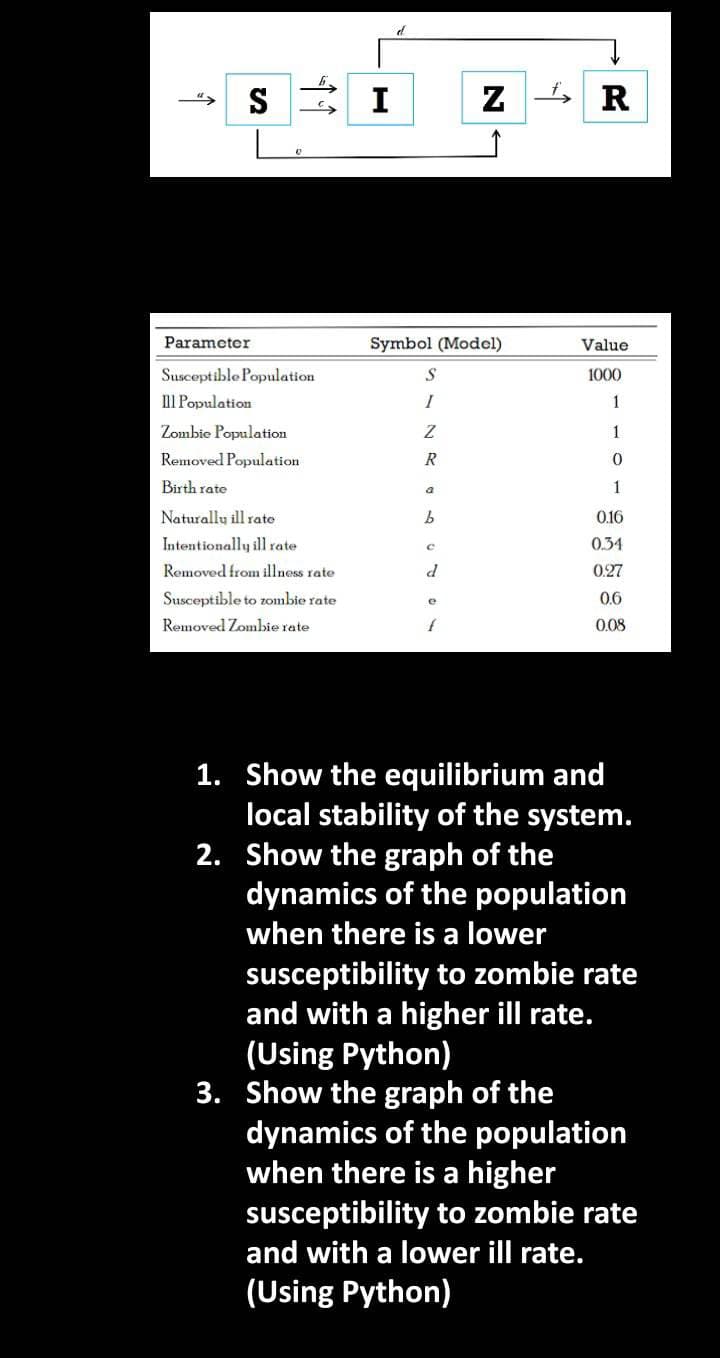
√² S 11 e Parameter Susceptible Population Ill Population Zombie Population Removed Population Birth rate Naturally ill rate Intentionally ill rate Removed from illness rate Susceptible to zombie rate Removed Zombie rate I Symbol (Model) S I Z R a b Z R C d Value 1000 1 1 0 1 0.16 0.34 0.27 0.6 0.08 2. 1. Show the equilibrium and local stability of the system. Show the graph of the dynamics of the population when there is a lower susceptibility to zombie rate and with a higher ill rate. (Using Python) 3. Show the graph of the dynamics of the population when there is a higher susceptibility to zombie rate and with a lower ill rate. (Using Python)
√² S 11 e Parameter Susceptible Population Ill Population Zombie Population Removed Population Birth rate Naturally ill rate Intentionally ill rate Removed from illness rate Susceptible to zombie rate Removed Zombie rate I Symbol (Model) S I Z R a b Z R C d Value 1000 1 1 0 1 0.16 0.34 0.27 0.6 0.08 2. 1. Show the equilibrium and local stability of the system. Show the graph of the dynamics of the population when there is a lower susceptibility to zombie rate and with a higher ill rate. (Using Python) 3. Show the graph of the dynamics of the population when there is a higher susceptibility to zombie rate and with a lower ill rate. (Using Python)

Operations Research : Applications and Algorithms
4th Edition
ISBN:9780534380588
Author:Wayne L. Winston
Publisher:Wayne L. Winston
Chapter19: Probabilistic Dynamic Programming
Section: Chapter Questions
Problem 10RP

Related questions
Question
Transcribed Image Text:S
11
Parameter
Susceptible Population
IlIl Population
Zombie Population
Removed Population
Birth rate
Naturally ill rate
Intentionally ill rate
Removed from illness rate
Susceptible to zombie rate
Removed Zombie rate
I
Symbol (Model)
S
I
Z
R
a
b
Z
C
d
R
Value
1000
1
1
0
1
0.16
0.34
0.27
0.6
0.08
2.
1. Show the equilibrium and
local stability of the system.
Show the graph of the
dynamics of the population
when there is a lower
susceptibility to zombie rate
and with a higher ill rate.
(Using Python)
3. Show the graph of the
dynamics of the population
when there is a higher
susceptibility to zombie rate
and with a lower ill rate.
(Using Python)
Expert Solution
This question has been solved!
Explore an expertly crafted, step-by-step solution for a thorough understanding of key concepts.
Step 1: Here is to show the equilibrium and local stability of the system.
VIEWStep 2: Show the graph of the dynamics of the population when there is a lower susceptibility to the zombie.
VIEWStep 3: Show the graph of the dynamics of the population when there is a higher susceptibility to the zombie
VIEWSolution
VIEW
Step by step
Solved in 4 steps with 3 images

Knowledge Booster


Learn more about
Need a deep-dive on the concept behind this application? Look no further. Learn more about this topic, computer-science and related others by exploring similar questions and additional content below.Recommended textbooks for you
Operations Research : Applications and Algorithms
Computer Science
ISBN:
9780534380588
Author:
Wayne L. Winston
Publisher:
Brooks Cole
Operations Research : Applications and Algorithms
Computer Science
ISBN:
9780534380588
Author:
Wayne L. Winston
Publisher:
Brooks Cole