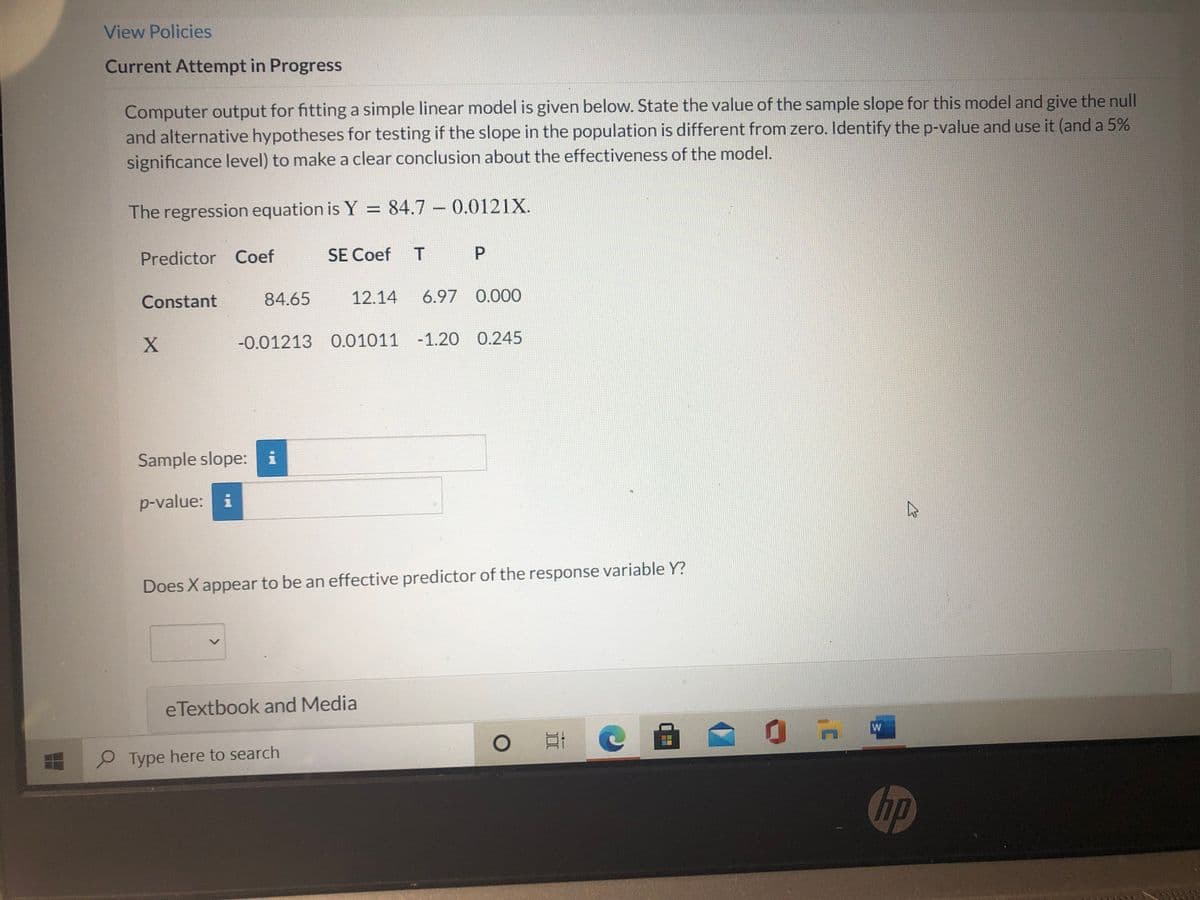
Sample slope: i p-value: i Does X appear to be an effective predictor of the response variable Y?


Q: Cereal again The correlation between a cereal’s fiberand potassium contents is r = 0.903. What…
A: The correlation between cereal’s fiber and potassium contents is r=0.903.
Q: quartiles is 0.6. If the sum of the upper and lower quartiles is 100 and In a frequency distribution…
A: Coefficient of skewness is a method to measure skewness of a distribution. There are many types of…
Q: Examples of the independent and paired-samples t-test?
A: 1): Example of independent and paired two sample t-test: Insulin rate is measured on few…
Q: frequency distribution, the percentage of samples have S.G. less * .than 2.75 is 95%
A: Here use less than cumulative frequency distribution
Q: 8. When testing for differences between treatment means, the t- statistic is based on A) the…
A: Analysis of Variance (ANOVA) is used to study the differences among and between the group means and…
Q: Q1. What is the sample size of your data? Qualitative Quantitative Neither Discrete Continuous…
A: There are 16 data points.
Q: 5. The camp wants to make sure that the average fun score does not depend on which activity is the…
A: Th camp wants to make sure that the average fun score does not depend on which activity is the…
Q: Determine the degree of freedom, right tailed area, t value Percentile - (10) n - (11)
A: Given that df=27 n=df+1=27+1=28 Right tailed area=0.01. Percentile: Percentile=1-Right tailed area…
Q: Q1. What is the sample size of your data? Qualitative Quantitative Neither Discrete Continuous…
A: Hi the question have more than 3 parts. As per the guidelines I am obliged to answer first three…
Q: Determine whether the samples are independent or dependent. The effectiveness of a headache medicine…
A: Answer:- Samples are dependent.
Q: Fertilizer bags are weighed as they come off a production line. The weights are normally distributed…
A:
Q: ii) Calculate the value of first and third quartile of data set by using percentile formula. iii)…
A:
Q: Test Score Frequency 3 1 4 4 5 2 6. 5 7 4 1 9 2 10 6 The mean score on this test is: The median…
A: Solution: The discrete frequency distribution of test scores is given. The formula of mean for a…
Q: From the sample data above, perform the following steps. d. At a 5% significance level, test the…
A: Given information: The data represents the values of the dependent variable and the independent…
Q: Identifying a Model and R2 Different samples are collected, and each sample consists of IQ scores of…
A: In the study, the sample data are collected from the IQ scores of 25 statistics students. The…
Q: The sample data below shows the number of hours spent by five students over the weekend to prepare…
A: Solution: The given data is 3, 12, 2, 3 and 5.
Q: Determine whether the samples are independent or dependent The effectiveness of a headache medicine…
A: Here we are measuring the intensity of a headache before and after drug treatment for each patient.…
Q: In point estimation O a. the mean of the population equals the mean of the sample O b. data from the…
A: Point Estimate: Point estimation involves the use of sample data to calculate a single value which…
Q: . Gestation and Average Longevity Is there a relationship between the gestation of a sample of…
A: Given data, X Y X*Y X*X Y*Y 105 5 525 11025 25 285 15 4275 81225 225 151 8 1208 22801 64…
Q: Research Scenario: A substance abuse counselor wants to demonstrate the effect of situational stress…
A: The data set is: Stressful Situation Neutral Situation 5 3 7 8 7 2 4 3 8 1 6 6 3 2…
Q: Number of alcoholic drinks per week (i.e., drinking) and GPA have r = -0.69, which of the following…
A: When the y variable tends to decrease as the x variable increases, it can be said that there is a…
Q: d. Coefficient of correlation means: Interpret the coefficient of correlation using this table.…
A: d. From the part b, the correlation value is r=0.4018. Here, the correlation value is positive and…
Q: The standardized regression coefficient describes the relationship between X and Y in terms of…
A: Here we know that standardized regression coefficient describes the correlation coefficients and its…
Q: Scenario: A therapist wanted to examine marital happiness in couples participating in therapy at her…
A: Given information: A therapist wanted to examine marital happiness in couples participating in…
Q: Using the data below: How do we create a bivariate analysis?
A: Introduction - Bivariate analysis- Bivariate analysis means the analysis of data . It is one of the…
Q: Total plasma volume is important in determining the required plasma component in blood replacement…
A: Hi, we are supposed to answer three sub parts at a time. So, I am answering the first three…
Q: he percentage of males 18 years and older who have never married is 30.4. For females, the…
A: From the provided information,
Q: Identify the TEST for the below scenario and explain why you will choose the test for the analysis…
A: It is mentioned to assume that the data was not normally distributed Also the groups given are…
Q: The sensitivity analysis in the Quality Sweaters example was on the response rate. Suppose now that…
A: The financial model that helps the company in determining the target variable affect the changes in…
Q: Can the population support of samples completed ? (margin of error =5%) (Z=1.96,p=0.6)
A:
Q: The manager of the company wants to know how different variables affect the sales of his vehicles. A…
A: Solution: The estimated regression equation is Sales^=1.7586+0.2124×Age-0.7527×MIL+4.8124×ENG
Q: Using the p-value given, are the results significant at a 1% level? p-value =0.34 Yes No
A: Determine the decision rule.
Q: R2 and adjusted-R2 are both statistical measures of goodness of fit
A: Here comparing basic definitions of both term R squared and adjusted R squared
Q: A population consist of numbers 3,6,9,12, and 20 and the sample size n=3 (apply the 8 steps ,upload…
A: Population Numbers are 3 6 9 12 20 From the given population samples are prepared with size 3…
Q: Determine the degree of freedom, right tailed area, t value Percentile - (4) n - (5) df - 28 Right…
A: Given that df=28 , Right-tailed area=0.10 Find the n , percentile, tcrit
Q: Brand of Carpet Family Income High Income Middle Income Brand A Brand B Brand C 65 32 32 80 68 104…
A: To test whether two categorical variables are related or not, a hypothesis test is used that is…
Q: How many degrees of freedom do you lose in a dependent samples t-test? 1, 2, 3, or 4?
A: How many degrees of freedom do you lose in a dependent samples t-test?
Q: A. Find the value of the test statistic. (Round to two or more decimal places.) B. Find the…
A:
Q: t. Reading is fundamental to a teenager's ability to perform well in school. Assume a researcher is…
A: Given Information: Sample size (n) = 10 Dependent variable (Y) is ACT reading score. Independent…
Q: Never Married People The percentage of males 18 years and older who have never married is 30.4. For…
A: Let p1: Proportion of men Let p2: Proportion of women Population proportion of men=P1=0.304…
Q: Describe when you would use an independent samples t-test versus a dependent samples t-test.
A: In an independent samples t-test, two different groups are investigated and in a dependent samples…
Q: Must the variable under consideration be normally distributed for you to use the ?-interval…
A:
Q: Matching type. For the give data, find the following measures of dispersion .
A:
Q: 1. Agriculture: Ground Water Unfortunately, arsenic occurs naturally in some ground water…
A: Given: Sample size, n=37Sample mean, x¯=7.2Sample sd, s=1.9α=0.01
Q: Range Mean Absolute Deviatio Sample Standar d Deviatio n Sample Variance
A: Let X be a random variable. Then, the range of the variable is the set of all possible values of X.…
Q: Unfortunately, arsenic occurs naturally in some ground watert. A mean arsenic level of u- 8.0 parts…
A: t-test: If the given sample size is less than or equal to 30 and sample standard deviation is given.…
Q: Statistics students in Oxnard College sampled 11 textbooks in the Condor bookstore, and recorded the…
A: Given information: The data represents the values of the variables x = number of pages and y = cost.
Q: The variation of data in a data set is determined by O a. Variance of the data O b. Percentile…
A: Task: to measure variation of the data:
Q: Which measure of center is preferable when the data contain outlier
A: Our aim is to find the which measure of center is preferable when the data contain outlier
Q: Determine the degree of freedom, right tailed area, t value Percentile - 95th n - 29 df - (7) Right…
A: Given that Percentile - 95thn - 29 Find df - (7)Right Tailed area - (8)t - (9)


Trending now
This is a popular solution!

Step by step
Solved in 2 steps with 2 images

- Olympic Pole Vault The graph in Figure 7 indicates that in recent years the winning Olympic men’s pole vault height has fallen below the value predicted by the regression line in Example 2. This might have occurred because when the pole vault was a new event there was much room for improvement in vaulters’ performances, whereas now even the best training can produce only incremental advances. Let’s see whether concentrating on more recent results gives a better predictor of future records. (a) Use the data in Table 2 (page 176) to complete the table of winning pole vault heights shown in the margin. (Note that we are using x=0 to correspond to the year 1972, where this restricted data set begins.) (b) Find the regression line for the data in part ‚(a). (c) Plot the data and the regression line on the same axes. Does the regression line seem to provide a good model for the data? (d) What does the regression line predict as the winning pole vault height for the 2012 Olympics? Compare this predicted value to the actual 2012 winning height of 5.97 m, as described on page 177. Has this new regression line provided a better prediction than the line in Example 2?Life Expectancy The following table shows the average life expectancy, in years, of a child born in the given year42 Life expectancy 2005 77.6 2007 78.1 2009 78.5 2011 78.7 2013 78.8 a. Find the equation of the regression line, and explain the meaning of its slope. b. Plot the data points and the regression line. c. Explain in practical terms the meaning of the slope of the regression line. d. Based on the trend of the regression line, what do you predict as the life expectancy of a child born in 2019? e. Based on the trend of the regression line, what do you predict as the life expectancy of a child born in 1580?2300The Mayor of texas whom is partners with a local agriculturalist wants to know how the amount of fertilizer and the amount of water given to plants affect their growth. The results were inputted into MINITAB so as to fit the model a) Write out the regression equation b) What is the sample size used in this investigation? c) Determine the values of *, ** and ***, **** d) Conduct a hypothesis test, at the 5% level of significance, to determine whether ? is significant. e) What would be the growth of the plant if 4g of fertilizer and 7g of ater was given to it daily? f) Carry out an F -test at the 1% significance level to determine whether the model is significant
- Is depression a possible factor in students missing classes? Two of the variables in the study are DepressionScore, which gives score on a standard depression scale with higher numbers indicating greater depression, and ClassesMissed, the number of classes missed during the semester, for a sample of 253 college students. Computer output is shown below. a). Write down the regression equation to predict ClassesMissed using DepressionScore. b). Interpret the coefficient of determination, R-Square. c). Test if DepressionScore is a significant predictor for ClassesMissed at 5% level (write down the hypotheses, p-value, and conclusion). d). Is DepressionScore a significant predictor for ClassesMissed at 1% level? Explain. (You do not need to perform a complete step of hypothesis test, only write the conclusion).A magazine surveyed graduates, asking about their point of view of the colleges they had attended. One good predictor of early career earnings ($/year) turned out to be the average SAT score of entering students. Here are the regression model and associated plots. Discuss the assumptions and conditions necessary for proceeding with the regression analysis. Do you think the conditions are satisfied? What conditions and assumptions must be satisfied? Select all that apply. A. Extrapolation Assumption B. Uniform Mean Assumption C. Independence Assumption D. Normal Population Assumption E. Linearity Assumption F. Reasonable Outliers Assumption G. Equal Variance AssumptionMiniature horses are a special breed of very very small horse. A minuature horse breeder is interested in the relationship between the size (height) of a miniature horse (x, in mm) and the price it sells for (y, in $). She decides to fit the simple linear regression model: E(y) = β0 + β1x A regression analysis using the heights and sale prices of 60 miniature horses gave the following results: Estimated slope coefficient (estimate for β1) = -7.0Standard error for the slope coefficient = 4.0Test statistic for the slope coefficient t = 1.750, to 3 decimal places, n-2 = 58 dfP-value for the slope coefficient = 0.08541 (to 5 decimal places). Is there significant evidence, at (alpha) α = 0.05, of a linear relationship between the size (height) of a miniature horse (x, in mm) and the price it sells for (y, in $). ? What is your conclusion? a. yes b. no
- (a) Calculate and write out the least-squares regression equation. (b) Calculate a 90% confidence interval for the slope ?1 of the regression. (c) Test the hypothesis that the altitude of origin affects the dark respiration rate. Write down the pair of hypotheses, specify the test statistic value or the P-value and state your conclusion of the test. Use ?=0.05 (d) For a batch of bugs collected at an altitude of 720 meters, what is the plausible range of the dark respiration rate? Provide an appropriate 95% interval (confidence interval or prediction interval). (e) What is the sample correlation coefficient?Chicken Chicken sandwiches are often advertisedas a healthier alternative to beef because many are lower in fat. Data from tests on 15 different sand-wiches randomly selected from the website http:// fast-food-nutrition.findthebest.com/d/a/Chicken-Sandwich produced the Calories vs. Fat scatterplot and the regression analysis below. a) Do you think a linear model is appropriate in thissituation?b) Describe the strength of this association.c) Write the equation of the regression line to estimatecalories from the fat content.d) Explain the meaning of the slope.e) Explain the meaning of the y-intercept. f) What does it mean if a certain sandwich has a nega-tive residual?On the first day of class, an economics professor administers a test to gauge the math preparedness of her students. She believes that the performance on this math test and the number of hours studied per week on the course are the primary factors that predict a student's score on the final exam. Using data from her class of 60 students, she estimates A portion of the regression results is shown in the following table. a. What is the slope coefficient of Hours? b. What is the sample regression equation? c. What is the predicted final exam score for a student who has a math score of 70 and studies 4 hours per week?
- A mail-order business selling personal computer supplies, software and hardware maintains a centralized warehouse. Management is currently examining the process of distribution from the warehouse and wants to study the factors that affect the warehouse distribution costs. Data collected over 24 random months contain the warehouse’s distribution cost (in thousands of Rands), the sales (in thousands of Rands) and the number of orders received. A multiple linear regression model was fitted to the data by using Stat1.2. Use the output to answer the questions that follow by typing only the letter of the correct option in the answer boxes. Variablesy: Warehouse Distribution Costx1: Salesx2: Number of Orders Model Fitting StatisticsR2 = 0.8504Adj R2: ? Regression Coefficients Beta Parameter Standard b Parameter Standard Estimates…Given the partial results from a linear regression model below, a sample size of 504, and ɑ=0.05, What is the F-Statistic for the overall model? Is it statistically significant? What is the R2 for the regression model above?A sociologist was hired by a large city hospital to investigate the relationship between the number of unauthorized days that employees are absent per year and the distance (miles) between home and work for the employee. A sample of 10 employees was chosen, and the following data were collected. A. Is the estimated regression equation appropriate and adequate


