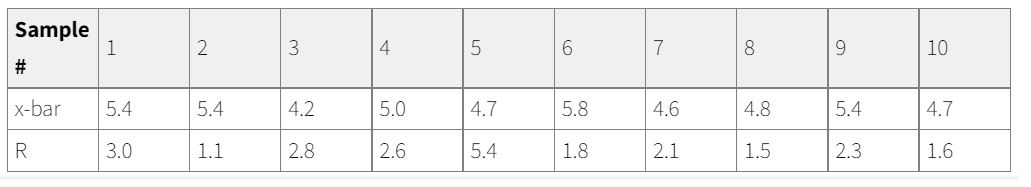
Sample # x-bar R 1 5.4 3.0 2 5.4 1.1 3 4.2 2.8 4 5.0 2.6 5 4.7 5.4 6 5.8 1.8 7 4.6 2.1 8 4.8 1.5 9 5.4 2.3 10 4.7 1.6


Q: If X∼ Normal(5,25), then P(X=5)=__
A: given data normal distribution X~N(5,25) P(x=5) = ?
Q: In a period of 100 minutes there were a total of 190 arrivals at a highway toll booth. The…
A: Given The data is as follows: Number of arrivalsin minutes 0 1 2 3 4 or more Observed frequency…
Q: The recent financial collapse has led to considerable concern about the information provided to…
A: Given The data is as follows: Discloser earnings forecasts Non-closer earnings forecast…
Q: Many shoppers have expressed dissatisfaction because grocery stores have stopped putting prices on…
A: Given::- Many shoppers have expressed dissatisfaction because grocery stores have stopped putting…
Q: or both? 6.101 Acme electronics manufactures MP3 players at three locations. The plant at Omaha…
A: Using the information from the 6.101, the following events are considered: The prob. that the MP3…
Q: The minimum injection pressure (psi) for injection molding specimens of high amylose corn was…
A: Given that: 15, 12.9, 17.9, 14.1, 12.4, 11, 9, 8.3
Q: In a data of 4 groups, SSB = 150, then MSB is equal to.......... a. 3.49 b. 50 C. 150. Od. 450 Clear…
A: Given data No. of groups = 4 SSB = 150MSB = ?
Q: Adding a constant c = 1 to a standard normally distributed random variable (red curve) is best…
A:
Q: S2) Assume that a car manufacturer wishes to determine if the new model of his cross over vehicle…
A: Given that: 27, 33, 24, 26, 30, 28, 22, 26, 25 Level of significance, α=0.01
Q: QUESTION 4 Express the null hypothesis and the alternative hypothesis in symbolic form for a test to…
A: According to the given information in this question We need to identify the correct option
Q: A manufacturer of household appliances wanted to determine if there was a relationship between…
A: The objective is to validate if an association between "family size" and "size of washing machine…
Q: QUESTION 9 Consider the simple linear regression model, y = ßo + B₁x + u. Which of the following…
A: The question is about regression Introduction : The simple reg. eq. is represented as y = β0 + β1 x…
Q: Adult men have heights with a mean of 69.0 inches and a standard deviation of 2.8 inches. Find the…
A: given data μ = 69.0 inchesσ = 2.8 inchesfor x = 63.9 inches; Z = ?
Q: A random sample of 100 individuals in one country finds 73% of them own a smart phone. What is the…
A: We have given that n = 100p = 73% = 0.73 Confidence level (c) = 95% = 0.95Significance level (α) = 1…
Q: 6. Based on earlier studies, monthly expenditures of newly graduates in Singapore is normally…
A: 6. Given Population mean, μ=1700 Population standard deviation, σ=680
Q: Mortality questions IRM 3300 1. What is the highest age for mortality for males and females between…
A: Given::- 2001 CSO Commissioners Standard Ordinary (CSO) Mortality Table deaths per 1000 Age Male…
Q: 5. Suppose that X₁, X2,..., Xn are an iid sample from the distribution given below, f(X)e =…
A: First we have to calculate the E(X) and V(X) for given pdf.
Q: If z is a standard normal random variable and P(-zy<Z<zy) = =0.99 then, a. zy = 0.001 b. zy=2.576 C.…
A: given data normal distribution P(-Zγ<Z<Zγ) = 0.99Zγ = ?
Q: What is the critical value z* needed to construct a 98% confidence interval? 1. What is the…
A: “Since you have posted multiple questions, we will provide the solution only to the first question…
Q: Alan, a highway safety inspector, is concerned about the potential for accidents caused by boulders…
A: Given data μ = 565σ = 100normal distribution P(493<x<681) = ?
Q: 3. From records, Shine Shine Jewel Pte Ltd noted that 75% of its customers are female. Internal…
A: Given information: 75% of the customers are females, and 15% of them will make a purchase while only…
Q: Mf2 . . Consider a European put option for non-dividend paying stock. The stock is currently…
A: Given::- Consider a European put option for non-dividend paying stock. The stock is currently…
Q: If X and Y are independent random variables with E(X) = 2, E(Y) = 2, Var(X) = 3, and Var(Y) = 1,…
A:
Q: 1. a) Assign each of the following to the highest appropriate level of measurement. Justify your…
A: Level of measurement : Nominal variables: This are categorical or qualitative variables with no…
Q: hypothesis test is conducted with H0 : µ = 18 vs. Ha: µ > 18. Given that the population is normal…
A: Given H0 : µ = 18 vs. Ha: µ > 18 x̅ = 21.2, σ = 10, n = 9
Q: It is common practice to compute an analysis of variance table in conjunction with an estimated…
A: Introduction The multiple regression shows a relationship b/w there is one dependent variable and…
Q: probability that 6.93 Find the probability of winning a state lottery in which one is required to…
A: Introduction: There are 40 numbers, 1, 2, 3, …, 40.
Q: Based on the boxplot above, identify the 5 number summary (min, Q1, median, Q3, max) The…
A:
Q: 370 WEB file NYSEStocks Chapter 8 Interval Estimation moign 47. Many stock market observers say that…
A: Given Sample size, n=30
Q: 1. You have run an experiment to test whether there is a hypothetical bias in people's willingness…
A: The data is given on people's willingness to pay for chocolate bars containing Fairtrade-certified…
Q: -(d) Show that E SS. - ܚ ܘܘ ?ܘ tn .-1 e) Under the null hypothesis, show that E(SS.) = (a-1)02.
A: Given that
Q: Question 2: Suppose your research team has just completed research and has collected data from a…
A: Given::- Suppose your research team has just completed research and has collected data from a sample…
Q: Use the giveh data to complete parts (a) and (b) below. yo 2.2 3.9 3.8 1.5 2.8 3.5 4.7 4.9 (Round to…
A: Part (a) : Using the Excel to draw the scatter plot for the given data. Steps : In excel, insert…
Q: For items 13-17 of the Tama Consider the random experiment of tossing a fair die twice. Use the PMF…
A: The probability of an event is the fraction of the number of favourable outcomes and the total…
Q: In your English class, essays are 40% of your grade, homework is 20% of your grade, attendance is 5%…
A: Given Information: The essay, homework, attendance, and final projects are 40%, 20%, 5%, and 35% of…
Q: A pharmaceutical company wishes to set a maximum efficacy guarantee on its drug for covid-19. Lab…
A: From given data we have : mean μ=67900 Standard deviation σ=2050
Q: 1) Histogram 2) Polygon 3) Ogive 48 56 73 65 39 48 74 74 84 51 71 55 76 85 68 42 79 58 73 81 51 81…
A:
Q: 6.95 In the game of poker, five the odds against the player receiving: (a) A royal flush (the ace,…
A: Given::- In the game of poker, five cards from a standard deck of 52 cards are dealt to each player.…
Q: 98 A regular tetrahedron consists of four sides. Each is equally likely to be the one facing down…
A: Given::- A regular tetrahedron consists of four sides. Each is equally likely to be the one facing…
Q: 6.55 Three marbles are drawn without replacement from an urn containing 4 red and 6 white marbles.…
A: Goven:;- Three marbles are drawn without replacement from an urn containing 4 red and 6 white…
Q: •2) You wish to know if the distribution of preferences for cake, ice cream, or cookies differs…
A: Since you have posted multiple questions, we will provide the solution only to the first question as…
Q: < 30 30-39 141 23 Need Item Yes 65 Pricing No 60 Age 40-49 50-59 82 63 5 3 ≥ 60 49 9 (a) Does the…
A:
Q: Cages used for supporting bearings in an aero engine have been tested under simulated operating…
A: Given::- Cages used for supporting bearings in an aero engine have been tested under simulated…
Q: cano questions be selected out of 10? 6.76 How many different committees of 3 men and 4 women can be…
A: The term "combination" refers to a combination of "x" items, only "n" of which are taken at a given…
Q: If the cost is low, might a very small but statistically significant difference be of practical…
A: Given::- If the cost is low, might a very small but statistically significant difference be of…
Q: A sample of male and female students were equipped with a device that records sound for one day.…
A:
Q: Find class boundaries, midpoint, and width for the class. 47-53 the class boundaries for the class…
A: class : 47-53 we have to find class boundaries ,midpoint ,width of class.
Q: Based on a random sample of customers at a departmental store, the table below shows the number of…
A: Given data:
Q: The regulation of electric and gas utilities is an important public policy question affecting…
A: Hi! Thank you for the question, As per the honor code, we are allowed to answer one question at a…
Assume that the service time

Step by step
Solved in 4 steps with 8 images

