Samples of size n-5 are taken from a manufacturing process every hour. A particular quality characteristic, which is normally distributed, is measured, and X-bar and R are calculated for each sample. After 25 samples, we have the following sums: E of X-bar values = 662.5 E of R values = 9.00 a) Find the Control Limits of the X-bar and R charts. b) Assume both charts exhibit "in control" behavior. If the process specifications are 26.40 plus or minus 0.30, estimate the fraction non-conforming. c) If the mean of the process were adjusted to exactly 26.40, what would be the new fraction non-conforming?
Samples of size n-5 are taken from a manufacturing process every hour. A particular quality characteristic, which is normally distributed, is measured, and X-bar and R are calculated for each sample. After 25 samples, we have the following sums: E of X-bar values = 662.5 E of R values = 9.00 a) Find the Control Limits of the X-bar and R charts. b) Assume both charts exhibit "in control" behavior. If the process specifications are 26.40 plus or minus 0.30, estimate the fraction non-conforming. c) If the mean of the process were adjusted to exactly 26.40, what would be the new fraction non-conforming?

Chapter2: Loads On Structures
Section: Chapter Questions
Problem 1P

Related questions

Question
Samples of sizen=5 are taken from a manufacturing process every hour. A particular quality characteristic, which is normally distributed, is measured, and X-ba and R calculated for each sample. After 25 samples, we have the following sums:
the sum of X-bar values =662.5
the sum of R values=9.0
a) Find the control limits of the X-bar and R-charts.
b) Assume both Charts exhibit "in control " behavior. If process specifications are 26.40 plus or minus 0.30, estimate the fraction nonconforming.
c)If the mean of the process were adjusted to exactly 26.40, what would be the new fraction non-conforming?
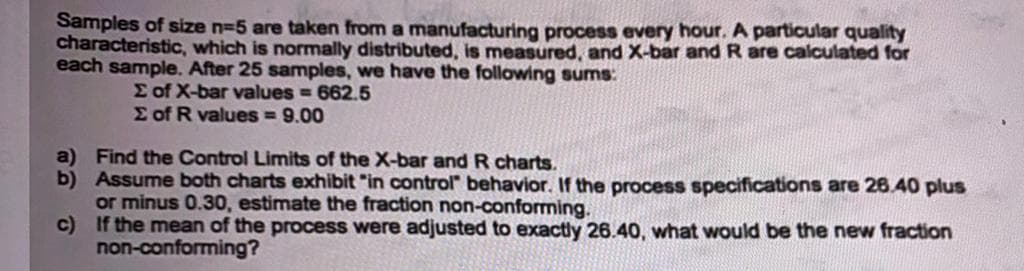
Transcribed Image Text:Samples of size n-5 are taken from a manufacturing process every hour. A particular quality
characteristic, which is normally distributed, is measured, and X-bar and R are calculated for
each sample. After 25 samples, we have the following sums:
E of X-bar values = 662.5
E of R values = 9.00
a) Find the Control Limits of the X-bar and R charts.
b) Assume both charts exhibit "in control" behavior. If the process specifications are 26.40 plus
or minus 0.30, estimate the fraction non-conforming.
c) If the mean of the process were adjusted to exactly 26.40, what would be the new fraction
non-conforming?
Expert Solution


Trending now
This is a popular solution!

Step by step
Solved in 9 steps with 12 images

Knowledge Booster


Learn more about
Need a deep-dive on the concept behind this application? Look no further. Learn more about this topic, civil-engineering and related others by exploring similar questions and additional content below.Recommended textbooks for you

Structural Analysis (10th Edition)
Civil Engineering
ISBN:
9780134610672
Author:
Russell C. Hibbeler
Publisher:
PEARSON

Principles of Foundation Engineering (MindTap Cou…
Civil Engineering
ISBN:
9781337705028
Author:
Braja M. Das, Nagaratnam Sivakugan
Publisher:
Cengage Learning
Structural Analysis (10th Edition)
Civil Engineering
ISBN:
9780134610672
Author:
Russell C. Hibbeler
Publisher:
PEARSON
Principles of Foundation Engineering (MindTap Cou…
Civil Engineering
ISBN:
9781337705028
Author:
Braja M. Das, Nagaratnam Sivakugan
Publisher:
Cengage Learning

Fundamentals of Structural Analysis
Civil Engineering
ISBN:
9780073398006
Author:
Kenneth M. Leet Emeritus, Chia-Ming Uang, Joel Lanning
Publisher:
McGraw-Hill Education


Traffic and Highway Engineering
Civil Engineering
ISBN:
9781305156241
Author:
Garber, Nicholas J.
Publisher:
Cengage Learning