Sarah has some data and wants to run a linear regression model on it. Before she runs the test, s- knows she needs to check to make sure all conditions are met. Based only on the plots below, what condition is not met? Data Scatterplot Normal Probability Plot Residual Scatterplot
Sarah has some data and wants to run a linear regression model on it. Before she runs the test, s- knows she needs to check to make sure all conditions are met. Based only on the plots below, what condition is not met? Data Scatterplot Normal Probability Plot Residual Scatterplot

Glencoe Algebra 1, Student Edition, 9780079039897, 0079039898, 2018
18th Edition
ISBN:9780079039897
Author:Carter
Publisher:Carter
Chapter4: Equations Of Linear Functions
Section: Chapter Questions
Problem 6SGR

Related questions
Question
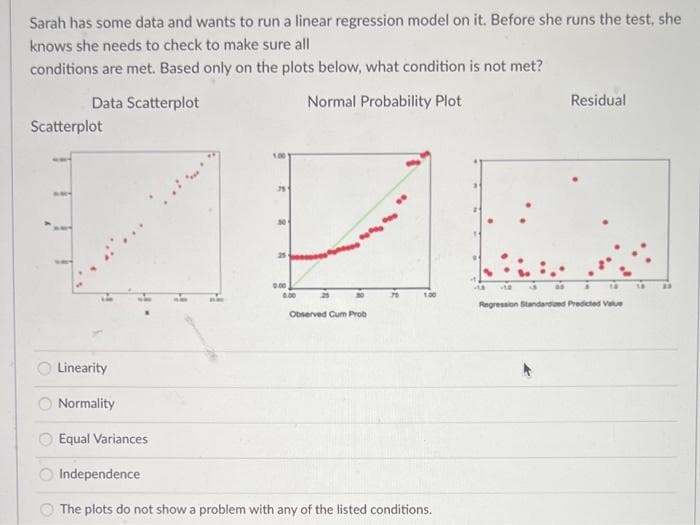
Transcribed Image Text:Sarah has some data and wants to run a linear regression model on it. Before she runs the test, she
knows she needs to check to make sure all
conditions are met. Based only on the plots below, what condition is not met?
Data Scatterplot
Normal Probability Plot
Residual
Scatterplot
25
100
Regression Standardoed Predcted Vale
Observed Cum Prob
Linearity
O Normality
Equal Variances
O Independence
O The plots do not show a problem with any of the listed conditions.
Expert Solution
This question has been solved!
Explore an expertly crafted, step-by-step solution for a thorough understanding of key concepts.

Step by step
Solved in 2 steps with 1 images

Recommended textbooks for you
Glencoe Algebra 1, Student Edition, 9780079039897…
Algebra
ISBN:
9780079039897
Author:
Carter
Publisher:
McGraw Hill

Algebra & Trigonometry with Analytic Geometry
Algebra
ISBN:
9781133382119
Author:
Swokowski
Publisher:
Cengage

Trigonometry (MindTap Course List)
Trigonometry
ISBN:
9781305652224
Author:
Charles P. McKeague, Mark D. Turner
Publisher:
Cengage Learning
Glencoe Algebra 1, Student Edition, 9780079039897…
Algebra
ISBN:
9780079039897
Author:
Carter
Publisher:
McGraw Hill
Algebra & Trigonometry with Analytic Geometry
Algebra
ISBN:
9781133382119
Author:
Swokowski
Publisher:
Cengage
Trigonometry (MindTap Course List)
Trigonometry
ISBN:
9781305652224
Author:
Charles P. McKeague, Mark D. Turner
Publisher:
Cengage Learning

College Algebra
Algebra
ISBN:
9781305115545
Author:
James Stewart, Lothar Redlin, Saleem Watson
Publisher:
Cengage Learning

Algebra and Trigonometry (MindTap Course List)
Algebra
ISBN:
9781305071742
Author:
James Stewart, Lothar Redlin, Saleem Watson
Publisher:
Cengage Learning

Functions and Change: A Modeling Approach to Coll…
Algebra
ISBN:
9781337111348
Author:
Bruce Crauder, Benny Evans, Alan Noell
Publisher:
Cengage Learning