SCUBA divers have maximum dive times they cannot exceed when going to different depths. The data in the table below show different depths with the maximum dive times in minutes. (Comma separated lists of the data are also provided below the table to ease in copying the data to R.) Depth in Feet (x) 50 60 70 80 90 100 T: 50, 60, 70, 80, 90, 100 y: 179, 166, 150, 138, 124, 110 1. Find the best fit line for the data. y = Maximum Dive Time in Minutes (y) 179 179.6222 16.6527 162.9695 X xx 3. Predict the maximum dive time at a depth of 23 feet. 166 150 138 124 110 2. Graph the scatter plot of the data together with the best fit line using R. (This portion of the problem is not graded.) 1
SCUBA divers have maximum dive times they cannot exceed when going to different depths. The data in the table below show different depths with the maximum dive times in minutes. (Comma separated lists of the data are also provided below the table to ease in copying the data to R.) Depth in Feet (x) 50 60 70 80 90 100 T: 50, 60, 70, 80, 90, 100 y: 179, 166, 150, 138, 124, 110 1. Find the best fit line for the data. y = Maximum Dive Time in Minutes (y) 179 179.6222 16.6527 162.9695 X xx 3. Predict the maximum dive time at a depth of 23 feet. 166 150 138 124 110 2. Graph the scatter plot of the data together with the best fit line using R. (This portion of the problem is not graded.) 1

Algebra & Trigonometry with Analytic Geometry
13th Edition
ISBN:9781133382119
Author:Swokowski
Publisher:Swokowski
Chapter4: Polynomial And Rational Functions
Section4.6: Variation
Problem 15E

Related questions
Question
100%
Please don’t reject
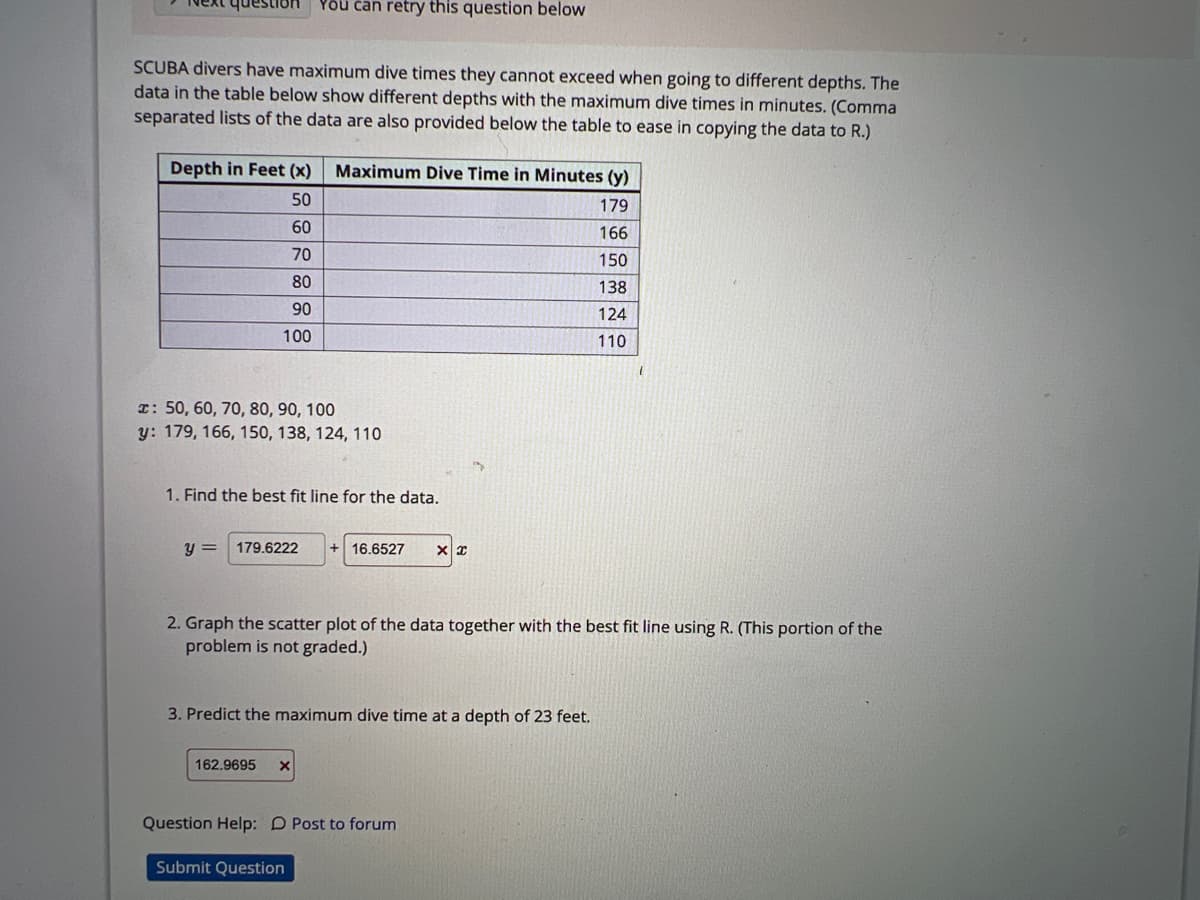
Transcribed Image Text:SCUBA divers have maximum dive times they cannot exceed when going to different depths. The
data in the table below show different depths with the maximum dive times in minutes. (Comma
separated lists of the data are also provided below the table to ease in copying the data to R.)
Depth in Feet (x)
50
60
70
80
90
100
You can retry this question below
x: 50, 60, 70, 80, 90, 100
y: 179, 166, 150, 138, 124, 110
y =
1. Find the best fit line for the data.
179.6222
Maximum Dive Time in Minutes (y)
179
162.9695 X
16.6527 XX
3. Predict the maximum dive time at a depth of 23 feet.
2. Graph the scatter plot of the data together with the best fit line using R. (This portion of the
problem is not graded.)
166
150
138
124
110
Question Help: D Post to forum
Submit Question
1
Expert Solution
This question has been solved!
Explore an expertly crafted, step-by-step solution for a thorough understanding of key concepts.

This is a popular solution!

Trending now
This is a popular solution!

Step by step
Solved in 4 steps with 2 images

Recommended textbooks for you
Algebra & Trigonometry with Analytic Geometry
Algebra
ISBN:
9781133382119
Author:
Swokowski
Publisher:
Cengage

Algebra & Trigonometry with Analytic Geometry
Algebra
ISBN:
9781133382119
Author:
Swokowski
Publisher:
Cengage