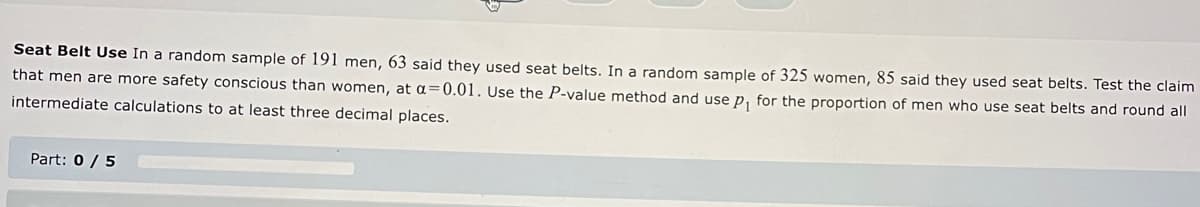
Seat Belt Use In a random sample of 191 men, 63 said they used seat belts. In a random sample of 325 women, 85 said they used seat belts. Test the claim that men are more safety conscious than women, at a=0.01. Use the P-value method and use p₁ for the proportion of men who use seat belts and round all intermediate calculations to at least three decimal places. Part: 0 / 5


Q: .The lifetime of a certain kind of electric bulb may be considered as a RV with mean 1200 hours and…
A:
Q: A traffic safety company publishes reports about motorcycle fatalities and helmet use. the first…
A: From given data we have ; Location of Injury Probability Frequency Multiple 0.570 1021 Head…
Q: For a population of normally distributed scores, μ = 120 and σ = 10, approximately what would be the…
A: Following is the formula for 95% confidence interval of the population mean…
Q: A hypothesis test procedure uses independent simple random samples to compare two unknown population…
A:
Q: Regression analysis was applied between sales data (y in $1000s) and advertising data (x in $100s)…
A: The estimated regression line of y on x is given as: y^=12+1.8x. It is given that:…
Q: n=12, x=28.0, s=5.7. Find a 99% confidence interval for the mean. Round to two decimal places as…
A: Given: n = 12 X = 28 s = 5.7 Formula Used: Confidence Interval = X ± t*sn
Q: 9. Political parties are key players in American politics. But the Constitution does not mention…
A: Given table of democrats and republicans along with primarily concerns about as shown below
Q: A random sample X₁, X2, X3, ..., X100 is given from a distribution with known varianc Var (X₂) = 81.…
A: Given: random sample X1, X2, X3, . . , X100 is given from a distribution with known variance Var(Xi)…
Q: parts of question 7. solve A-E A. Compute P(X = 3) for n = 5, p = 1
A: Note: Questions A, B, C, D, and E are three different questions. As per the answering guidelines I…
Q: 2. Explains the meaning of the statement of the following equation (image and explanation)
A: Given information: The statement is given related to probability. PB(A)=Card (A∩B)Card(B) Find:…
Q: QUESTION 9 An employment information service claims the mean monthly salary for full-time workers…
A: Solution ; Given that, Claim : the mean monthly salary for full-time workers over age of 25 and…
Q: A binary message (0 or 1) is communicated through a noisy channel with A as the message transmitted…
A:
Q: If X and Y are independent random variables and U=X+ Y, complete the proof that the cumulative…
A:
Q: c) What should the guaranteed delivery time be on packages so that 90% of the packages will be…
A: The given mean is 15 and standard deviation is 2.
Q: For your introductory psychology research methodology course you received a score of 34 on the final…
A: The following information has been provided: For Introductory psychology research methodology course…
Q: Which of the following would be a good dummy variable? (Select all that apply.) 1 None of these…
A: Dummy variable is used to decode the categorical data. Dummy variables are coded as 0 or 1.
Q: Find the value of Za 20.12 20.12 = (Round to two decimal places as needed.) ***
A: given data standard normal distributionZ~N(0,1)we have to find value of Z0.12
Q: Acme Corporation manufactures light bulbs. The CEO claims that an average Acme light bulb lasts 300…
A:
Q: Name Age Salary Donor? Nancy 21 37,000 N Jim 27 41,000 Allen 43 61,000 Jane 38 55,000 Steve 44…
A:
Q: Suppose that a state offered voluntary standardized tests to all its third graders and that these…
A: TO find: Which of the following would generate selection bias?
Q: (d) Compute the standard deviation of the random variable X. 0x = hits (Round to three decimal…
A: Let's solve for the question numbered d, e and f as all the questions before them are answered…
Q: Which of the following statements are true? It is okay to use the median to estimate the mean…
A: From the given options only third point is true a s per the point estimation. So option 3(iii only )…
Q: How many randomly selected employers must we contact in order to create an estimate in which we are…
A:
Q: 3) Koby is mixing birdseed. He wants 2/5 of the mixture to be millet and 3/5 of the mixture to be…
A: Note: As per Bartleby guidelines only one question can be answered. Kindly, resubmit for other…
Q: For the data in the following table, what is the value of ΣX? X f 4 1 3 2 2 4 1 2 10 15 20…
A: Given data is X f 4 1 3 2 2 4 1 2
Q: Let X be a random variable with a variance of 4. Find the variance of X+9. Answer: Var(X + 9) =…
A: Given: V(X) = 4
Q: Consider the following linear regression model: Yt = Bo + B₁x1t + B₂X2+ + Ut Instead of estimating ,…
A: Given that the linear regression model is,…
Q: Use the time/tip data from the table below, which includes data from New York City taxi rides. (The…
A: Regression is the statistical technique which used to predict the value based on the another…
Q: Concurrent Validity. When the instrument can predict results similar to those similar tests already…
A: Given: Concurrent Validity Definition and Examples
Q: Help with P Value
A: Formula Used: Test-statistic t = X1-X2sp1n1+1n2 sp =(n1-1)s12+(n2-1)s22n1+n2-2
Q: A population of values has a normal distribution with μ=194 and σ=53. You intend to draw a random…
A: Given : A population of values has a normal distribution with μ=194 and σ=53.
Q: There's a math processing error on G and H, could you please fix that?
A: X is within two standard deviation of its mean value means EX-2SD≤X≤EX+2SD. Given that EX=107 and…
Q: An insurance company is trying to estimate the average number of sick days that full-time food…
A:
Q: Determine if each of the following statements is true or false, and explain why. A 95% confidence…
A: The objective is to determine which of the given statements is true or false.
Q: where did you get 16 from ?
A: The mean is 113.6, standard deviation is 14 and sample size is 221.
Q: 1000 randomly selected Americans were asked if they believed the minimum wage should be raised. 600…
A: Givensample size(n)=1000x=600sample proportion(p^)=xn=6001000=0.6confidence level=95%
Q: xpress the confidence interval 79.8%±4.9% in interval form. Express the answer in decimal format…
A: Confidence interval are used to determine the range where the true population range lies. It has two…
Q: Golf Scores A random sample of second-round golf scores from a major tournament is listed below. At…
A: Given data: Significance level = 0.01 Claim: At α=0.01, is there sufficient evidence to conclude…
Q: If the lines of regression of Y on X and X on Y are respectively a₁ X + b₁Y+c₁ = 0 and a₂X + b₂Y+c₁₂…
A:
Q: Write the formula for the estimated regression line and interpret the slope of the estimated…
A: Please note that as per our guidelines if multiple sub-parts are there in a question we can answer…
Q: A large super market chain is doing market research in the City of Long Beach to determine whether…
A: Hypothesis test are used to measure the mean significance between the sample and population. If the…
Q: If var(X) = var(Y) = σ², cov(X,Y)= and 2Y-3 find the correlation between 2X+3
A:
Q: Use the following pairs of observations to construct an 80% and a 98% confidence interval for B₁. X…
A: Given:
Q: May I know the Q5 and the process
A: Solution-: Given data: 55,46,63,57,61,65,96,55,74,32,67,59 We want to find, (a) Mode=? (b) Give the…
Q: 3. (a) (b) Environmental Science & Technology (1993) reported on a study of contaminated soil in The…
A: As per our guidelines we are supposed to answer only 3 sub-parts of any questions so i am solving…
Q: Two suppliers manufacture a plastic gear used in a laser printer. The impact strength of these…
A: Given: Two suppliers manufacture a plastic gear used in a laser printer. The impact strength of…
Q: Find the indicated IQ score. The graph to the right depicts IQ scores of adults, and those scores…
A: Mean(µ) = 100Standard deviations (σ) = 15X ~ N (µ, σ )= N(100, 15)
Q: Let X~ Unif(0, 2) and Y~ Bi(2, 0.5). If Z is a mixture of X and Y with equal weights, graph the…
A: Given that X~Unif0,2Y~Bi2,0.5 fX=12-0, 0≤X≤2FX=X-02-0, 0≤X≤2 =X2,…
Q: Consider a panel data set and the following regression model. Yit Bo + B₁Xit + ++ Uit What do…
A: Option B is the answer Generally, bo is y intercept(constant term) b1 is slope
Q: 7.Find the value of k if f (x, y) = k(1- x)(1- y) for0 < x, y < 1 is to be joint density function.
A: We have given that f(x,y) = k(1 - x)(1 - y) , for 0 < x , y <1

Step by step
Solved in 3 steps with 3 images

- A medical researcher says that less than 80% of adults in a certain country think that healthy children should be required to be vaccinated. In a random sample of 200 adults in that country, 76% think that healthy children should be required to be vaccinated. At α=0.05, is there enough evidence to support the researcher's claim? Complete parts (a) through (e) below. Let p be the population proportion of successes, where a success is an adult in the country who thinks that healthy children should be required to be vaccinated. (a) Find the critical value(s) and identify the rejection region(s). z0=______ (b) Identify the rejection region(s). (c) Find the standardized test statistic z. z=______ (d) Decide whether to reject or fail to reject the null hypothesis and (e) interpret the decision in the context of the original claim.A veterinary nutritionist developed a diet for overweight dogs. The total volume of food consumed remains the same, but one-half of the dog food is replaced with a low-calorie “filler” such as canned green beans. Six overweight dogs were randomly selected from her practice and were put on this program. Their initial weights were recorded, and they were weighed again after 4 weeks. The results of the experiment are shown below. At α=0.05, can it be concluded that the dogs significantly lost weight?At any age, about 20% of American adults participate in fitness activities at least twice a week. However, these activities change as people get older, and occasionally participants cease to be older as they age. In a local survey of n = 100 adults over 40, a total of 15 people indicated that they participated in these activities at least twice a week. Does this data indicate that the percentage of participation for adults over 40 years of age is considerably less than the 20% figure? Find the p-value and use it to draw the appropriate conclusions.
- A sample of 323 urban adult residents of a particular state revealed 65 who favored increasing the highway speed limit from 55 to 65 mph, whereas a sample of 177 rural residents yielded 75 who favored the increase. Does this data indicate that the sentiment for increasing the speed limit is different for the two groups of residents? (a) Test H0: p1 − p2 = 0 versus Ha: p1 − p2 ≠ 0 using ? = 0.05, where p1 refers to the urban population. (Round your test statistic to two decimal places and your P-value to four decimal places.) z = P-value = State the conclusion in the problem context. Fail to reject H0. The data suggests that the sentiment for increasing the speed limit is different for the two groups of residents.Reject H0. The data suggests that the sentiment for increasing the speed limit is different for the two groups of residents. Fail to reject H0. The data does not suggest that the sentiment for increasing the speed limit is different for the two groups of…Victims of Violence A random survey of 75 women who were victims of violence found that 22 were attacked by relatives. A random survey of 53 men found that 14 were attacked by relatives. At a=0.05, can it be shown that the percentage of women who were attacked by relatives is less than the percentage of men who were attacked by relatives? Use p1 for the proportion of women who were attacked by relatives. Use the P-value method with tables. Part 2. State the hypotheses and identify the claim with the correct hypothesis. Part 3. Compute the test value. Always round score values to two decimal places. Part 4. Find the -value. Round the answer to four decimal places. Part 5. Reject or not to reject the null hypothesis.Victims of Violence A random survey of 86 women who were victims of violence found that 20 were attacked by relatives. A random survey of 54 men found that 6 were attacked by relatives. At α=0.10, can it be shown that the percentage of women who were attacked by relatives is different from the percentage of men who were attacked by relatives? Use p1 for the proportion of women who were attacked by relatives. Use the P-value method with tables. State the hypotheses and identify the claim with the correct hypothesis. H0: claim/do not claim? H1: claim/do not claim? This hypothesis test is one tailed/two tailed? Compute the test value. Round all intermediate steps to four decimal places and always round z score values to tow decimal places. Z= Compute the P-value. Round the answer to four decimal places. P -value = Make the decision. Reject/do not reject the null hypothesis. Summarize the results. There is/ is not enough evidence to support the claim t
- Arsenic-based additives in chicken feed have been banned by the European Union. Ifa restaurant chain finds significant evidence that the mean arsenic level of theirchickens is above 80 ppb (parts per billion), the chain will stop using that supplier ofchicken meat. The hypotheses are: H 0 : µ = 80H 1 : µ > 80 where µ represents the mean arsenic level in all chicken meat from that supplier.Samples from two different suppliers are analyzed, and the resulting p-values aregiven: Sample from Supplier A: p-value is 0.0003Sample from Supplier B: p-value is 0.3500 a) Interpret each p-value in terms of the probability of the results happening byrandom chance. b) Which p-value shows stronger evidence for the alternative hypothesis? c) Which supplier, A or B, should the chain get chickens from in order to avoid toohigh a level of arsenic?In a recent survey, the average amount of moneystudents have in their pockets is $5.40 with a standarddeviation of $1.20. A teacher feels that the averageamount is actually higher. She surveys 80 randomlyselected students and finds the average amount is$5.50. At α = 0.05, test the teacher’s claim that theaverage amount of money is actually higher than $5.40.Workers in the office like to drink coffee during work. A doctor is concerned about this situation since the too much coffee consumption may result to long-term health problems. However, studies suggests that there is no risk in drinking three cups of coffee per day, which is about 250 mg of caffeine. The doctor wants to know if the amount of caffeine consumed by the workers is within tolerable limits. He randomly selected 20 students and found that they consume an average of 270 mg of caffeine each day with a standard deviation of 48 mg. Assume that the daily amount of caffeine consumed by students follow the normal distribution.1. Which of the following sets of hypotheses should be used in this study? A. Ho: μ = 250 vs. Ha: μ > 250 B. Ho: μ ≤ 250 vs. Ha: μ > 250 C. Ho: μ = 270 vs. Ha: μ > 270 D. Ho: μ = 270 vs. Ha: μ ≠ 270 2. Which of the following is(are) TRUE? I. The appropriate test procedure to answer the objective of the study is a…
- A sample of patients is tested to determine if they have any hospital borne infections. How large of a sample must be collected to be accurate within 0.01 at the 1% level of significance, if the hospital estimates the true proportion of patients infected is 0.045? p̂ = q̂ = E = Z= n=Varric has conducted a within subjects ANOVA to determine if his band of pirates have significantly improved in their swashbuckling abilities over the past four months. The results of his analysis are as follows [F(3, 58) = 5.22, p = 0.07]. Should he run a post-hoc test? A. Yes, always run a post hoc test after conducting an ANOVA regardless of the result B. No, post hoc tests should only be conducted when an ANOVA yields a significant result C. No, post-hoc tests are not appropriate for a within subjects ANOVA D. Yes, post hoc tests should only be conducted when the ANOVA yields a non-significant result


