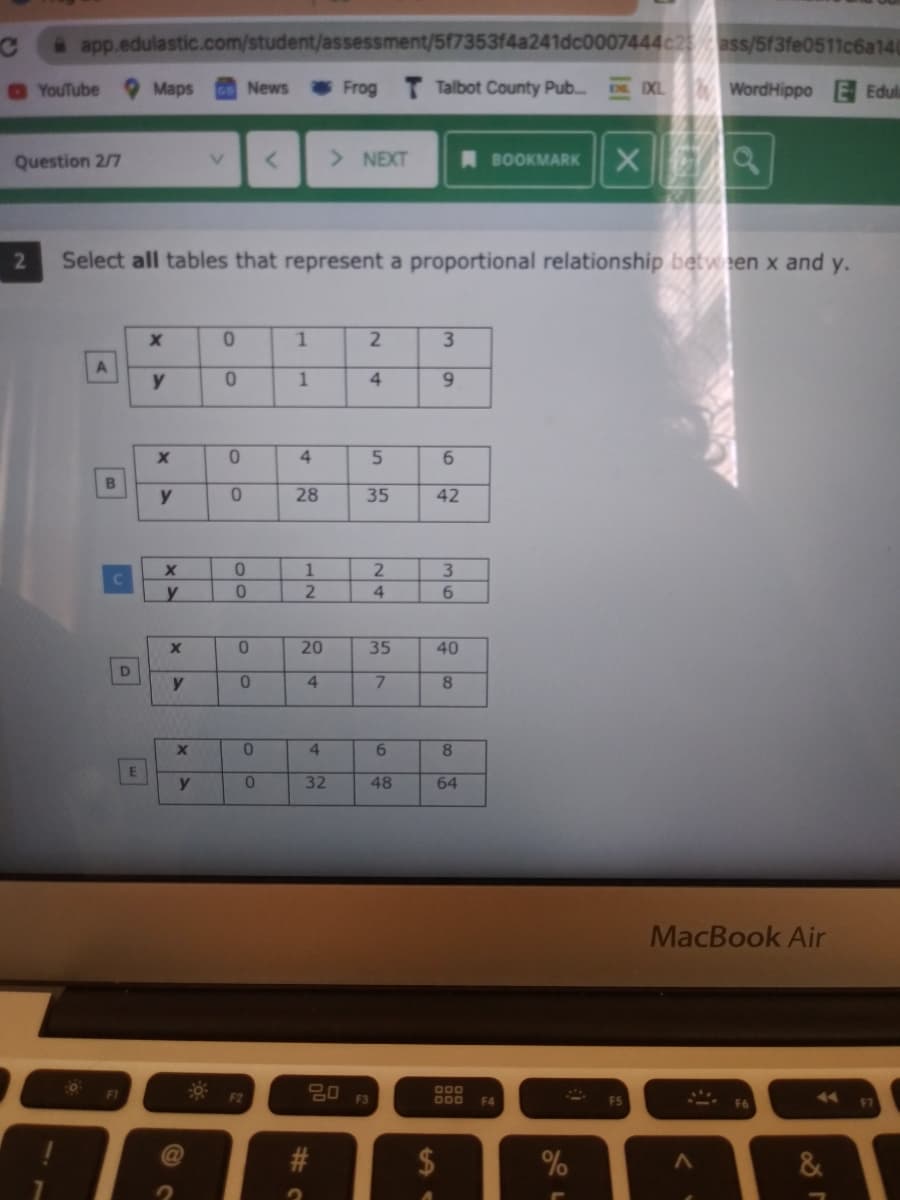
Select all tables that represent a proportional relationship between x and y. 2. 3. y 1 4. 6. 5. 6. y 28 35 42 0. 20 35 40 y 7. 8. 8. 01 32 48 64 36 24 69 4, 12 4) 4, 1. 190 EI 13 D. B. A.
Q: Which table has a constant of proportionality between y and z of Choose 1 answer: 2 15 12 30 3 10 18…
A: If you observe the second table, from the first row, y=6 and x=3 y=6=2*3=2x from the second row,…
Q: Liam Jack 2.) Nathan Lucas 24 Minutes Laps Minutes Minutes Laps Laps 3.5 20 2. 2. 16 4 6. 12 3. 10.5…
A:
Q: 9. The table and equation below show the proportional relationship between time, in seconds, x, and…
A: (9) Comparison of speed and distance travelled by two remote-controlled car x is the time in seconds…
Q: Two different proportional relationships are represented by the equation and the table. Propořtion A…
A: Solution: Our objective is to find the conclusion
Q: 5) Assume that you face some very strange data. Let's say that you believe the relationship between…
A: @solution::: Thank you for asking this question.
Q: 2. Does this graph represent a proportional relationship? If so what is the constant 6+ 5+ 4+ 3+ 2+…
A: given, we
Q: The following graph shows a proportional relationship. What is the constant of proportionality…
A:
Q: Which table has a constant of proportionality between y and x of 4? Choose 1 answer: 4 16 6. 36 16…
A: Solution:- check whether there is some relation between x and y value.
Q: The table below shows values of y as a function of x. y 2 8 6 15 10 22 22 43 30 57 Which linear…
A:
Q: Number of T-shirts Total cost of T-shirts in dollars 1 10 15 20 4 25 30 6. 35 Which statement about…
A: In the question it is asked to choose correct option for the following table given below.
Q: After determining whether the variation model below is of the form y = kx or y find the value of k.…
A: the given variation model is: we have to determine whether the variation model is of the form y=kx…
Q: Determine which of the following describes qualitative data. i). the volume of a shipping container,…
A: here we know that shape and name comes under qualitative data, 1- volume of the container does not…
Q: L) The following table describes the relationship between the number of scoops in an ice crean cone…
A:
Q: Select the tables that show a proportional relationship between x and y y 4. 15 14 8. 2. 6. 1. 3. 5.…
A:
Q: e data, 12 8 10 2 ue of
A:
Q: I hope I put this in the correct place. I need help to see if I figured out the question correctly.…
A: Given: the condition of two cars. Where x represents the time in second and y represents the…
Q: The table below shows the cost, s, to purchase p pounds of steak at a local grocery store. Number of…
A: If x= ky then x and y are proprotional where k is a constant. Here also we will try to find a…
Q: For the data set below, use graph to determine if y 14.4 59 134 4 420 700.4 3 4 O A. x is…
A: Solution
Q: 23. When a weightlifter lifts weights, the total weight lifted, y, is based on the weight of the bar…
A:
Q: Вook Pages (x variable) Price (y variable) $7.00 $8.25 $7.25 $10.00 500 B 610 C 550 D 650 $7.25…
A: Hello! As you have posted more than 3 sub parts, we are answering the first 3 sub-parts. In case…
Q: Match each scatterplot to the statement that best describes it. 12 12 10 10- 2- 2- 10 12 6. 12 (a)…
A: a. Linear: The points seem to be following a line then it is called linear. From the scatterplot,…
Q: Which situation represents a proportional relationship? The cost of purchasing a basket of oranges…
A: Here, we have to find the statement which is the proportional relationship.
Q: Select the tables that show a proportional relationship between x and y. 14
A:
Q: The table below shows the cost, s, to purchase p pounds of steak at a local grocery store. Number of…
A:
Q: Which graph shows a proportional relationship between x and A) B) C) D)
A: select the graph which show the relationship of x and y…
Q: consider the data sets below, determine if it is reasonable to assume that y is proportional to x.…
A: Two varying quantities are said to be in proportion if they are multiplicatively connected to a…
Q: Does the following table of values describe a liner fuction, if it does what is the rate of change x…
A:
Q: 4 3.) Does the table represent a proportional relationship? 2. 5. y 7. 8. A. Yes, because all the…
A: I am going to solve the given problem by using some smple algebra to get the required result.
Q: The following data is given: x023 5 6 y| 1|1 7 11 20
A:
Q: An equation, shown below, represents the rates of three quantities 2 4, 3 z x'y IrX-, y-š. find the…
A: Given: 2z=4x+3yx=45y=65 To Find: z=?
Q: The table shows the proportional relationship between the cost in dollars (c) of vegetable oil and…
A:
Q: Country Population Size Number of Eggs Consumed Number of Cattle Area United States 325…
A:
Q: 6. 18 10 30 13 39 16 48 20 60 ) Select the equation that shows the cost of vegetable oil. Ac = 54w…
A:
Q: Which table has a constant of proportionality between y and x of 10? Choose 1 answer: 20 A 12 132 22…
A: Question is about proportionality of x and y
Q: W 4 28 8 56 12 84 16 112 18 126 O Select the equation that shows the cost of olive oil. (A)C = 7w…
A: The solution as follows :-
Q: The table and equation below show the proportional relationship between time, in seconds, x, and…
A:
Q: This table shows a proportional relationship between x and y. 6 y 1.25 4 2.5 6. 3.75 10 6.25 What is…
A: Constant of proportionality y=Kx K=y/x K = 1.25/2 = 0.625
Q: For the data set below, use the graph to determine if 14.4 59 134.4 420 700,4 2. 3. 4 6. AYs…
A: y 14.4 59 134.4 420 700.4 x 2 3 4 6 7 Using graph To determine whether y is proportional to…
Q: Which of the following linear relationships also represent proportional relationships? Select ALL…
A:
Q: 70 60 50 40 30 20 10 O 10 20 30 40 50 60 70 s0 The equation that represents this relationship is y =…
A:
Q: The table shows the proportional relat W 6. 18 27 11 33 14 42 18 54 Select the equation that shows…
A:
Q: 4 28 49 11 77 15 105 19 133
A: w c 4 28 7 49 11 77 15 105 19 133
Q: After determining whether the variation model below is of the form y = kx or y find the value of k.…
A: Algebra proportion
Q: 4. Which of the following is proportional to 3: 2? A. 9:8 B. 6:4 C. 12: 10 D. 12:9 5. Pamela drove…
A: We have to solve questions based on application of Ratio.
Q: Here is a graph that shows the price of blueberries at two different stores. 40 30 44.5, 2가- 20 (3,…
A: The given graph is :
Q: 14. Which of the following describes a proportional relationship? a. Jonathan opens a savings…
A: It is definition proportional relationship
Q: For children between the ages of 18 months and 29 months, there is approximately a linear…
A:
Q: Consider the data sets below, determine if it is reasonable to assume that y is proportional to x.…
A:
Q: 11. Does the table show a proportional relationship? If so, what is the value of y when x is 10? X 5…
A: The solution is given below
Q: In an area of the Great Plains, records were kept on the relationship between the rainfall (in…
A: Given data and calculation for linear coefficient is shown below
Trending now
This is a popular solution!
Step by step
Solved in 2 steps
- If the Correlation Coefficient (r) between two variable was calculated to be 0.7898, what percent (%) of the variation of the dependent variable is due to the variation of the independent variable? Group of answer choices 103.1% 33.1% 62.4% 94.0%A study was undertaken to determine whether there was a significant weight (in lb) loss after one year course of therapy for diabetes, and whether the amount of weight (in lb) loss was related to initial weight. The following table gives the initial weight (x) and weight after one year of therapy (y) for 16 newly diagnosed adult diabetic patients.A sports analyst for the National Basketball Association wonders whether there is a relationship between a basketball player's average points per game (PPG) and his average minutes per game (MPG). The accompanying table lists a portion of the data that he collected for ten players. (You may find it useful to reference the t table.) Player PPG MPG 1 30.4 37.8 2 30.4 36.8 3 28.5 35.3 4 27.7 36.4 5 27.6 35.5 6 27.1 38.4 7 24.6 37.9 8 24.6 34.1 9 24.5 37.5 10 24.4 36.7 Sample correlation coefficient. test statistic
- The Senator of Azenator State, is worried about the rising numbers in high blood pressure related deaths in his Jurisdiction and wants an end to this canker. A reputable medical research officer has claimed that, the situation is probably as a result of the ageing population of his State. The blood pressures, Y (mmHg), and Ages, X (years) of 10 hospital patients were sampled from Azenator State and summarized below. Patient A B C D E F G H I J Age(X) in Years 20 25 50 30 45 60 10 15 35 70 BP(Y) in (mmHg) 80 85 125 90 100 135 80 70 100 140 NB: Approximate to 2 decimal placesUse the table to answer the questions that follow;i) Calculate the product moment correlation coefficient for the data and interpret your result.ii) If the Senator decides to purchase and distribute Norvasc (a medicine that reduces blood pressure), based on your results in (i), which age group (youth or old adults) should be given priority? Briefly explain your answer. iii) Give a reason to support fitting…Ernesto is a web developer who is looking to determine which of two types of advertisements are the most cost effective. He suspects that advertisements with animations generate more clicks than advertisements without animations but wants to confirm his intuition before he starts recommending advertisements with animations to his clients. Ernesto creates advertisements with animations for 12 different products and then creates advertisements without animations for those same products. Then he measures the click-through rate for those advertisements. The data are provided below (given as percentages of total visitors to the site who clicked on the advertisement). Assume that the conditions required for this hypothesis test are satisfied. Use a calculator to test the paired data, where α=0.01. Compute the sample differences d using d=Without−With. Which of the following statements are accurate for this hypothesis test in order to evaluate the claim that the true mean difference between…A researcher desires to know if the age of a child is related to the number of cavities he or she has. The data is below. Age of child, x 6 8 9 10 12 14 No. of cavities, y 2 1 3 4 6 5 Perform a hypothesis test to determine if there is a linear relationship between the variables. Find the coefficient of determination and interpret it Using s, determine if there are any outliers.
- A music fan claims that R&B songs and Rap songs differ in terms of their positivity. The individual collected two independent random samples from the population of all songs on Spotify. Fifteen R&B songs and another fifteen Rap songs were collected and their Valence was recorded. Remember, the variable Valence is measured on a 0 to 1 scale. Songs with high valence sound more positive (e.g. happy, cheerful, euphoric), while songs with low valence sound more negative (e.g. sad, depressed, angry). We will subtract (R&B – Rap) and use the 10% significance level. Assume the Central Limit Theorem conditions hold. The data set is called RBRapSample31. Please import the data set into Rguroo or find it in our group. Define the population parameter in context and symbols in one sentence. State the hypotheses you would use to test the claim that a difference exists in the mean Valence between R&B and Rap songs using correct notation.A well-known maker of jams and jellies packages its jams in jars labeled "~250 milliliters." The process used to fill the jars is known to dispense an amount of jam that is a Normally distributed variable µ = 252 milliliters and σ = 0.9 milliliters. What proportion of jars will be filled with what the label claims is 250 milliliters?Use the table below to answer this quesiton: Leukemia No leukemia Exposed to benzene 23 9,236 Not exposed to benzene 45 40,253 What is the relative risk of leukemia among those exposed to benzene compared to those not exposed to benzene?