Select the correct answer below: O The probability of observing a value of to = 1.65 or more if the null hypothesis is true is between 0.05 and 0.20. The probability of observing a value of to = -1.65 or less or observing a value of to = 1.65 or more if the null hypothesis is true is between 0.10 and 0.20. O The probability of observing a value of to =-1.65 or less or observing a value of to = 1.65 or more if the null hypothesis is true is between 0.01 and 0.02. ing avalue of t 1 66 or less if the null hynothesis is true is between 0.005 and 0.01. probabilie
Select the correct answer below: O The probability of observing a value of to = 1.65 or more if the null hypothesis is true is between 0.05 and 0.20. The probability of observing a value of to = -1.65 or less or observing a value of to = 1.65 or more if the null hypothesis is true is between 0.10 and 0.20. O The probability of observing a value of to =-1.65 or less or observing a value of to = 1.65 or more if the null hypothesis is true is between 0.01 and 0.02. ing avalue of t 1 66 or less if the null hynothesis is true is between 0.005 and 0.01. probabilie

Glencoe Algebra 1, Student Edition, 9780079039897, 0079039898, 2018
18th Edition
ISBN:9780079039897
Author:Carter
Publisher:Carter
Chapter10: Statistics
Section10.4: Distributions Of Data
Problem 19PFA

Related questions

Topic Video
Question
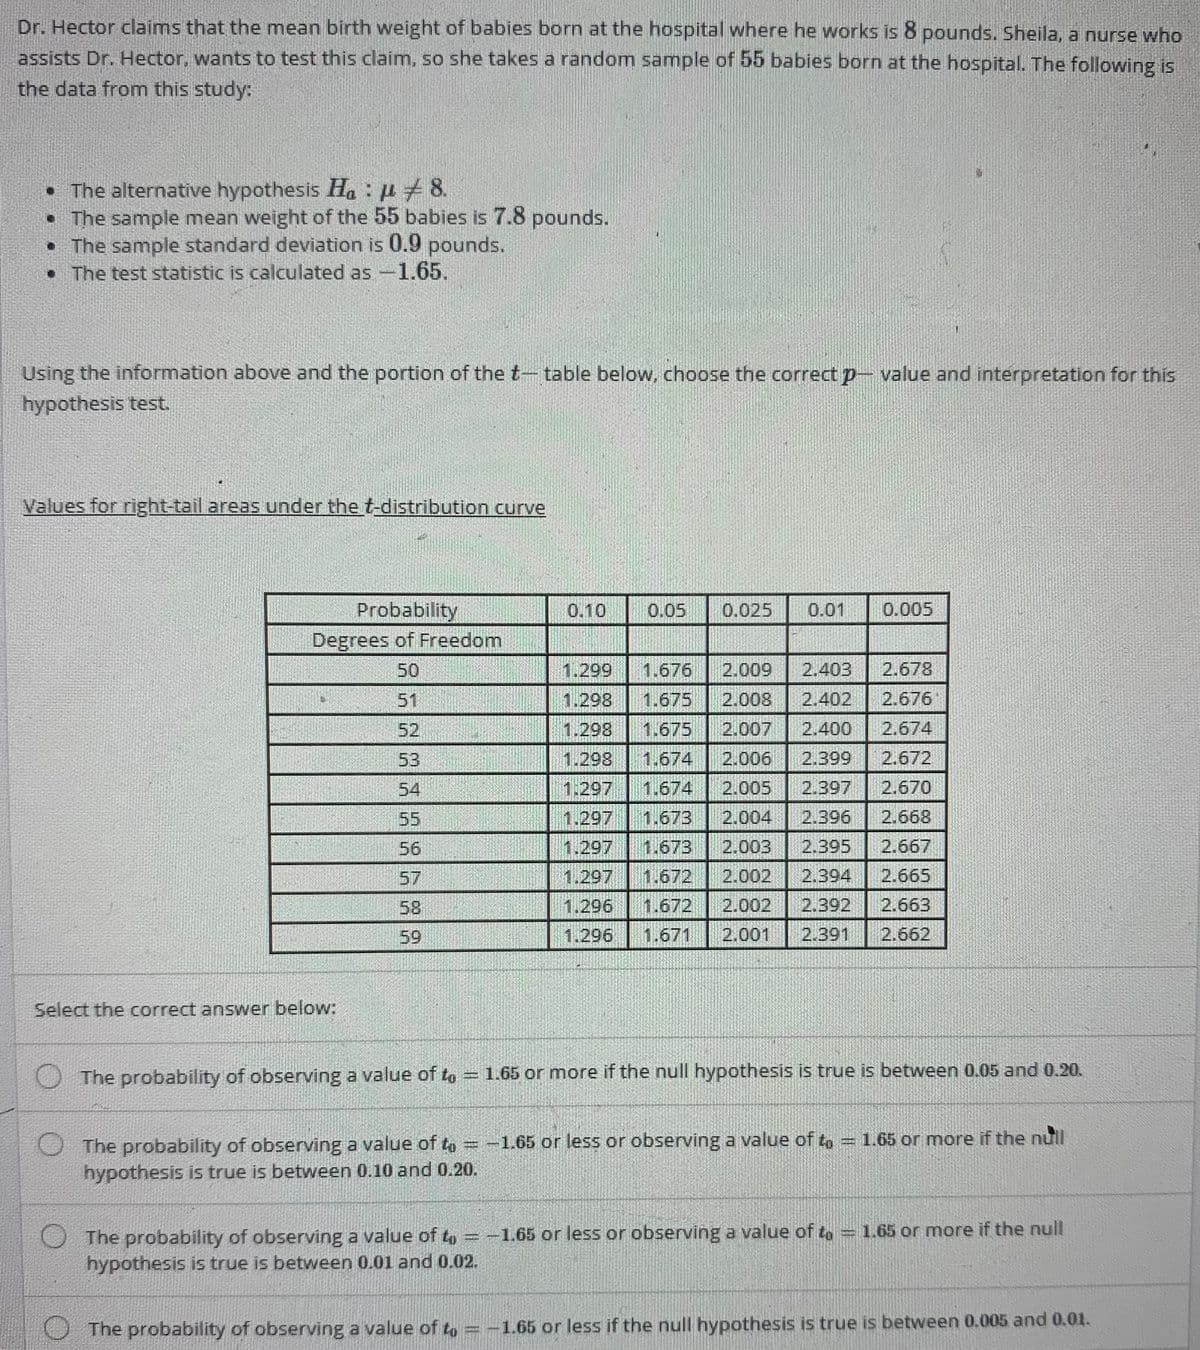
Transcribed Image Text:Dr. Hector claims that the mean birth weight of babies born at the hospital where he works is 8 pounds. Sheila, a nurse who
assists Dr. Hector, wants to test this claim, so she takes a random sample of 55 babies born at the hospital. The following is
the data from this study:
• The alternative hypothesis H.: p+8.
• The sample mean weight of the 55 babies is 7.8 pounds.
• The sample standard deviation is 0.9 pounds.
• The test statistic is calculated as -1.65.
Using the information above and the portion of the t- table below, choose the correct p- value and interpretation for this
hypothesis test.
Values for right-tail areas under the t-distribution curve
Probability
Degrees of Freedom
0.10
0.05
0.025
0.01
0.005
50
1.299
1.676
2.009
2.403
2.678
51
1.298
1.675
2.008
2.402
2.676
52
1.298
1.675
2.007
2.400
2.674
53
1.298
1.674
2.006
2.399
2.672
54
1.297
1.674
2.005
2.397
2.670
55
1.297
1.673
2.004
2.396
2.668
56
1.297
1.673
2.003
2.395
2.667
57
1.297
1.672
2.002
2.394
2.665
58
1.296
1.672
2.002
2.392
2.663
59
1.296
1.671
2.001
2.391
2.662
Select the correct answer below:
The probability of observing a value of to = 1.65 or more if the null hypothesis is true is between 0.05 and 0.20.
The probability of observing a value of t, = -1.65 or less or observing a value of to = 1.65 or more if the null
hypothesis is true is between 0.10 and 0.20.
The probability of observing a value of t = -1.65 or less or observing a value of to = 1.65 or more if the null
hypothesis is true is between 0.01 and 0.02.
The probability of observing a value of t, = -1.65 or less if the null hypothesis is true is between 0.005 and 0.01.
Expert Solution
This question has been solved!
Explore an expertly crafted, step-by-step solution for a thorough understanding of key concepts.

Step by step
Solved in 2 steps

Knowledge Booster


Learn more about
Need a deep-dive on the concept behind this application? Look no further. Learn more about this topic, statistics and related others by exploring similar questions and additional content below.Recommended textbooks for you
Glencoe Algebra 1, Student Edition, 9780079039897…
Algebra
ISBN:
9780079039897
Author:
Carter
Publisher:
McGraw Hill
Glencoe Algebra 1, Student Edition, 9780079039897…
Algebra
ISBN:
9780079039897
Author:
Carter
Publisher:
McGraw Hill