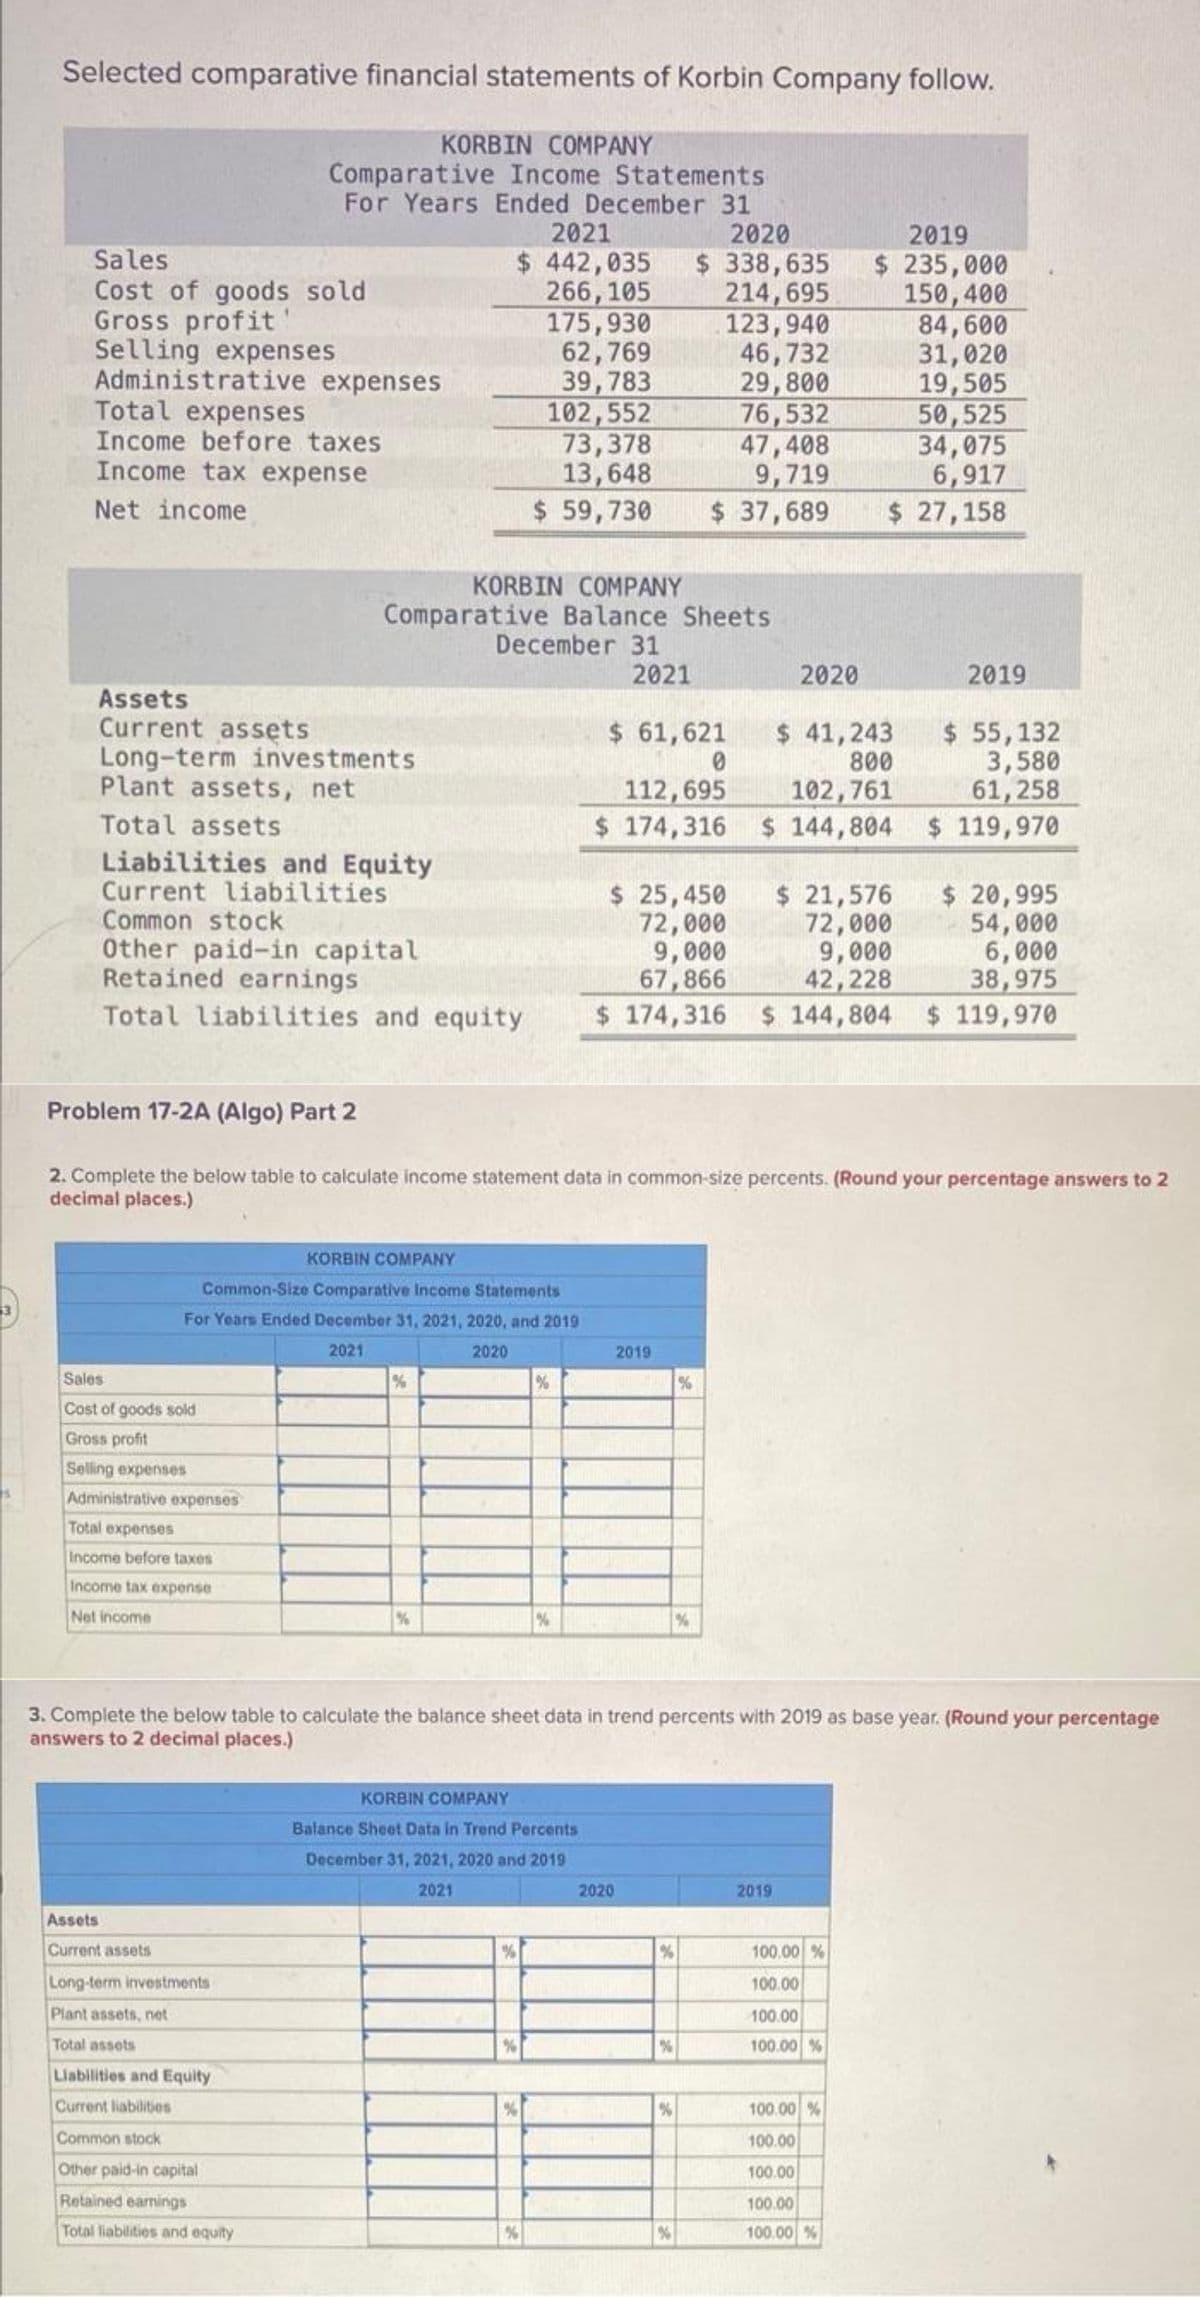
Selected comparative financial statements of Korbin Company follow. Sales Cost of goods sold Gross profit Selling expenses Administrative expenses Total expenses Income before taxes Income tax expense Net income Assets Current assets Long-term investments Plant assets, net Total assets KORBIN COMPANY Comparative Income Statements For Years Ended December 31 2021 2020 2019 $ 442,035 $ 338,635 $ 235,000 266,105 214,695 150,400 Liabilities and Equity Current liabilities Common stock Other paid-in capital Retained earnings Sales Cost of goods sold Gross profit Selling expenses Administrative expenses Total expenses Income before taxes Income tax expense Net income KORBIN COMPANY Comparative Balance Sheets Assets Current assets Long-term investments Plant assets, net Total assets KORBIN COMPANY Common-Size Comparative Income Statements For Years Ended December 31, 2021, 2020, and 2019 2021 2020 Liabilities and Equity Current liabilities Common stock Other paid-in capital Retained earnings Total liabilities and equity December 31 175,930 62,769 39,783 102,552 73,378 13,648 $ 59,730 $ 37,689 % $ 25,450 $ 21,576 $ 20,995 72,000 54,000 72,000 9,000 9,000 6,000 67,866 42,228 38,975 Total liabilities and equity $ 174,316 $ 144,804 $ 119,970 % Problem 17-2A (Algo) Part 2 2. Complete the below table to calculate income statement data in common-size percents. (Round your percentage answers to 2 decimal places.) % % KORBIN COMPANY Balance Sheet Data in Trend Percents December 31, 2021, 2020 and 2019 2021 % % 2021 $ 61,621 0 112,695 $ 174,316 2019 3. Complete the below table to calculate the balance sheet data in trend percents with 2019 as base year. (Round your percentage answers to 2 decimal places.) 2020 123,940 46,732 29,800 76,532 47,408 9,719 % % % % % 2020 $ 41,243 $ 55,132 800 102,761 3,580 61,258 $ 144,804 $ 119,970 2019 84,600 31,020 19,505 50,525 34,075 6,917 $ 27,158 100.00 % 100.00 100.00 100.00 % 2019 100.00 % 100.00 100.00 100.00 100.00 %
Selected comparative financial statements of Korbin Company follow. Sales Cost of goods sold Gross profit Selling expenses Administrative expenses Total expenses Income before taxes Income tax expense Net income Assets Current assets Long-term investments Plant assets, net Total assets KORBIN COMPANY Comparative Income Statements For Years Ended December 31 2021 2020 2019 $ 442,035 $ 338,635 $ 235,000 266,105 214,695 150,400 Liabilities and Equity Current liabilities Common stock Other paid-in capital Retained earnings Sales Cost of goods sold Gross profit Selling expenses Administrative expenses Total expenses Income before taxes Income tax expense Net income KORBIN COMPANY Comparative Balance Sheets Assets Current assets Long-term investments Plant assets, net Total assets KORBIN COMPANY Common-Size Comparative Income Statements For Years Ended December 31, 2021, 2020, and 2019 2021 2020 Liabilities and Equity Current liabilities Common stock Other paid-in capital Retained earnings Total liabilities and equity December 31 175,930 62,769 39,783 102,552 73,378 13,648 $ 59,730 $ 37,689 % $ 25,450 $ 21,576 $ 20,995 72,000 54,000 72,000 9,000 9,000 6,000 67,866 42,228 38,975 Total liabilities and equity $ 174,316 $ 144,804 $ 119,970 % Problem 17-2A (Algo) Part 2 2. Complete the below table to calculate income statement data in common-size percents. (Round your percentage answers to 2 decimal places.) % % KORBIN COMPANY Balance Sheet Data in Trend Percents December 31, 2021, 2020 and 2019 2021 % % 2021 $ 61,621 0 112,695 $ 174,316 2019 3. Complete the below table to calculate the balance sheet data in trend percents with 2019 as base year. (Round your percentage answers to 2 decimal places.) 2020 123,940 46,732 29,800 76,532 47,408 9,719 % % % % % 2020 $ 41,243 $ 55,132 800 102,761 3,580 61,258 $ 144,804 $ 119,970 2019 84,600 31,020 19,505 50,525 34,075 6,917 $ 27,158 100.00 % 100.00 100.00 100.00 % 2019 100.00 % 100.00 100.00 100.00 100.00 %

Managerial Accounting: The Cornerstone of Business Decision-Making
7th Edition
ISBN:9781337115773
Author:Maryanne M. Mowen, Don R. Hansen, Dan L. Heitger
Publisher:Maryanne M. Mowen, Don R. Hansen, Dan L. Heitger
Chapter15: Financial Statement Analysis
Section: Chapter Questions
Problem 40E: Cuneo Companys income statements for the last 3 years are as follows: Refer to the information for...

Related questions
Question
Transcribed Image Text:Selected comparative financial statements of Korbin Company follow.
KORBIN COMPANY
Comparative Income Statements
For Years Ended December 31
2021
2020
$ 442,035 $ 338,635
266,105
214,695
123,940
46,732
29,800
76,532
47,408
9,719
Sales
Cost of goods sold
Gross profit!
Selling expenses
Administrative expenses
Total expenses
Income before taxes
Income tax expense
Net income
Assets
Current assets
Long-term investments
Plant assets, net
Total assets
Liabilities and Equity
Current liabilities
Common stock
Other paid-in capital
Retained earnings
KORBIN COMPANY
Comparative Balance Sheets
Sales
Cost of goods sold
Gross profit
Selling expenses
Administrative expenses
Total expenses
Income before taxes
Income tax expense
Net income
Assets
Current assets
KORBIN COMPANY
Common-Size Comparative Income Statements
For Years Ended December 31, 2021, 2020, and 2019
2021
2020
Long-term investments
Plant assets, net
Total assets
175,930
62,769
39,783
102,552
73,378
13,648
$ 59,730 $ 37,689
Liabilities and Equity
Current liabilities
Common stock
Other paid-in capital
Retained earnings
Total liabilities and equity
December 31
%
%
$ 20,995
$ 25,450
72,000
9,000
54,000
6,000
67,866
38,975
Total liabilities and equity $ 174,316 $144,804 $ 119,970
Problem 17-2A (Algo) Part 2
2. Complete the below table to calculate income statement data in common-size percents. (Round your percentage answers to 2
decimal places.)
%
%
2021
$ 61,621
0
KORBIN COMPANY
Balance Sheet Data in Trend Percents
December 31, 2021, 2020 and 2019
2021
112,695
$ 174,316
2020
2019
3. Complete the below table to calculate the balance sheet data in trend percents with 2019 as base year. (Round your percentage
answers to 2 decimal places.)
%
%
%
2020
%
%
2019
$ 235,000
150,400
$ 55,132
3,580
61,258
$ 144,804 $ 119,970
$ 41,243
800
102,761
2019
84,600
31,020
19,505
50,525
34,075
6,917
$ 27,158
$ 21,576
72,000
9,000
42,228
2019
100.00 %
100.00
100.00
100.00 %
100.00 %
100.00
100.00
100.00
100.00 %
Expert Solution
This question has been solved!
Explore an expertly crafted, step-by-step solution for a thorough understanding of key concepts.

This is a popular solution!

Trending now
This is a popular solution!

Step by step
Solved in 2 steps with 2 images

Knowledge Booster


Learn more about
Need a deep-dive on the concept behind this application? Look no further. Learn more about this topic, accounting and related others by exploring similar questions and additional content below.Recommended textbooks for you
Managerial Accounting: The Cornerstone of Busines…
Accounting
ISBN:
9781337115773
Author:
Maryanne M. Mowen, Don R. Hansen, Dan L. Heitger
Publisher:
Cengage Learning

Fundamentals of Financial Management (MindTap Cou…
Finance
ISBN:
9781337395250
Author:
Eugene F. Brigham, Joel F. Houston
Publisher:
Cengage Learning

Intermediate Accounting: Reporting And Analysis
Accounting
ISBN:
9781337788281
Author:
James M. Wahlen, Jefferson P. Jones, Donald Pagach
Publisher:
Cengage Learning
Managerial Accounting: The Cornerstone of Busines…
Accounting
ISBN:
9781337115773
Author:
Maryanne M. Mowen, Don R. Hansen, Dan L. Heitger
Publisher:
Cengage Learning
Fundamentals of Financial Management (MindTap Cou…
Finance
ISBN:
9781337395250
Author:
Eugene F. Brigham, Joel F. Houston
Publisher:
Cengage Learning
Intermediate Accounting: Reporting And Analysis
Accounting
ISBN:
9781337788281
Author:
James M. Wahlen, Jefferson P. Jones, Donald Pagach
Publisher:
Cengage Learning

Financial And Managerial Accounting
Accounting
ISBN:
9781337902663
Author:
WARREN, Carl S.
Publisher:
Cengage Learning,

Managerial Accounting
Accounting
ISBN:
9781337912020
Author:
Carl Warren, Ph.d. Cma William B. Tayler
Publisher:
South-Western College Pub

Survey of Accounting (Accounting I)
Accounting
ISBN:
9781305961883
Author:
Carl Warren
Publisher:
Cengage Learning