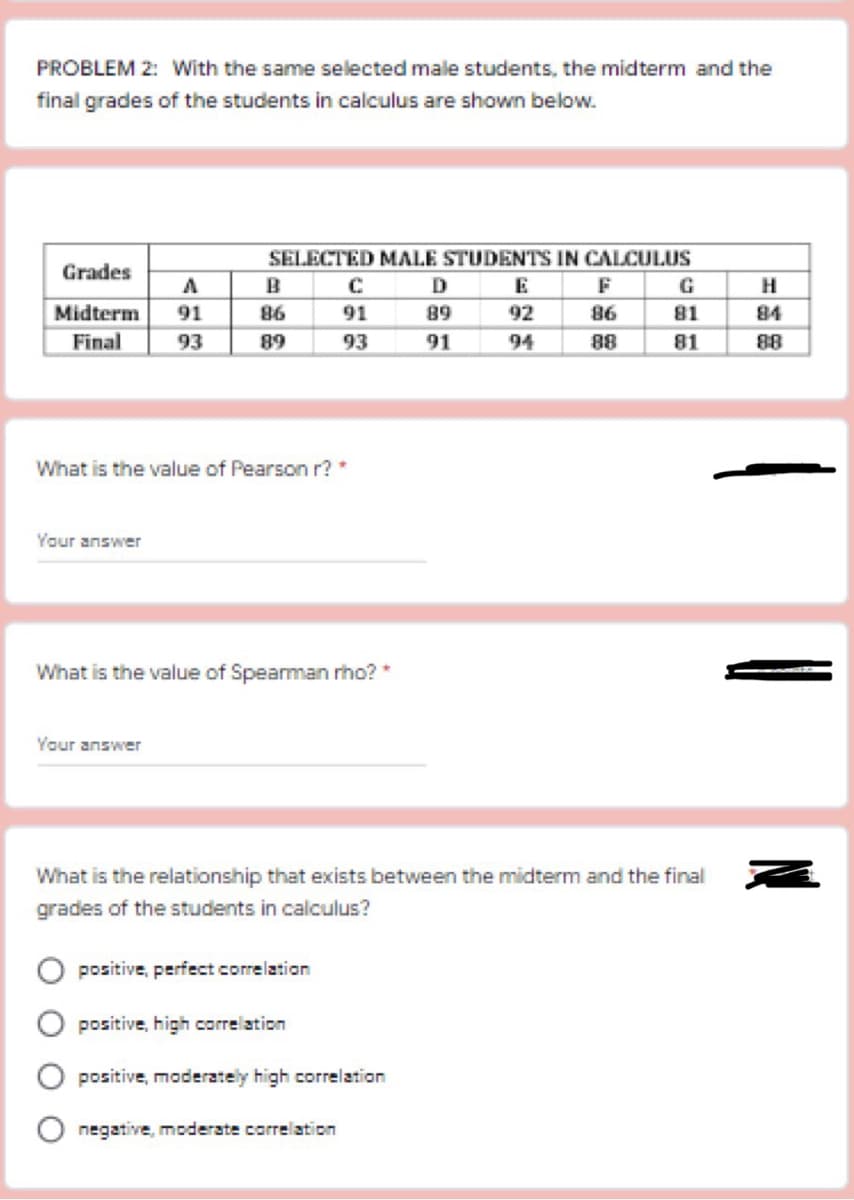
SELECTED MALE STUDENTS IN CALCULUS Grades A B C D E F G Midterm 91 86 91 89 92 86 81 Final 93 89 93 91 94 88 81 What is the value of Pearson r?* Your answer What is the value of Spearman rho? * Your answer What is the relationship that exists between the midterm and the final grades of the students in calculus? positive, perfect correlation positive, high correlation positive, moderately high correlation negative, moderate correlation H 84 88


Q: Chocolate-cream cheese Strawberry-white chocolate Coconut Coconut Coconut Chocolate-cream cheese…
A: Given a bar graph, we have to describe the distribution for the flavor of cupcake for the sample of…
Q: (b) The following table gives the results of 250 samples, all of same size, drawn from the same…
A:
Q: Which of the following ideas is false when calculating the estimate?
A: here basic of confidence Interval Chevrolet's customer relations department wishes to estimate the…
Q: Determine the percent of the population for the following given that mu = 100 and sigma = 15 Draw a…
A: According to the given information in this question We need to solve three parts of this question…
Q: 4: Two mathematics teachers working in a school want to compare whether there is a difference…
A: Given information: Teacher A Teacher B 78 83 60 45 51 54 50 44 45 15 40 40 27 71…
Q: Instruction: Complete the table below. Solve the mean (2 methods), median (2 methods), and the mode.…
A: Given information: Score interval f 60 to 64 8 65 to 69 11 70 to 74 12 75 to 79 25 80…
Q: Use R programming or excel to answer the following. Visualize your answers. Consider the…
A: Given Information: Consider the given data: Quarter Year 1 Year 2 Year 3 1 923 1112 1243 2…
Q: le and interpret
A: The P-value is the probability, computed considering the null hypothesis is true, by calculating the…
Q: lease help! :< STATISTICS AND PROBABILITY (PLEASE SHOW your COMPLETE & CLEAR solutions) RATE WILL…
A: A sample of 150 households in the area; n=150 An investigator found that members of 60 households ;…
Q: 11.1 Events A and B are independent .Given that ● P(A only) = 0.4 P(A and B)= 0.3 P(B only) = x…
A: Given that events A and B are independent events And P(A only) =0.4 P(A and B) =0.3 [intersection…
Q: Over the past decade, an insurance company has had a mix of 40% whole life policies, 25% universal…
A:
Q: Is that a big baby? The average birth weight in the US is µ ≈ 120 ounces (7 pounds, 8 ounces) with a…
A: According to the given information in this question We need to find the z score value
Q: areem received a $1900 bonus. He decided to invest it in a 3-year certificate of deposit (CD) with…
A: From the given information we find final amount and interest earned.
Q: Miller (2008) examined the energy drink consumption of college undergraduates and found that males…
A: Given μ = 30 σ = 14 n=8 X-bar=16
Q: Two machines used for cutting steel are calibrated to cut exactly the same lengths. To test this…
A:
Q: Find the Z-score such that the area under the standard normal curve to the right is 0.45 Click the…
A: To find the area to the right of 0.45
Q: probability that the mean for 25 randomly selected distances is greater than 200.30 cm. the normal…
A: Given Mean=202.5cm Standard deviation =8.6cm
Q: 1. Calculate the Range: 2. Calculate the Mean (2): 3. Calculate the Average Deviation : the Variance
A: It is given that the weight of grade 7 students of ETTMNIHS. Range: It is the difference between…
Q: Problem in statistics: frequency of whose ith size x; is f; is given by : ositsi Prove that the mean…
A: Given that We have to prove that Mean deviation about the mean of variable x with frequency fi…
Q: ngers. The time between calls for tickets is exponentially distributed with a mean of 30 minutes.…
A: Given The mean time between arrivals is 30 minutes. Therefore the mean number of arrivals in 3 hours…
Q: TABLE 3.4 A distributor of table wines conducted a study of the relationship between price and…
A:
Q: Please help! :< STATISTICS AND PROBABILITY (PLEASE SHOW your COMPLETE & CLEAR solutions) RATE WILL…
A:
Q: A group of students measured the mass of an object using a balance with accuracy 0.02. the measured…
A: The provided information is Mean =67.25+67.25+67.25/3=201.75/3=67.25…
Q: nt of determination is 49%, the strength of the linear relationship is equal to _______. Expr
A: Given: Stories Height (in ft) 57 820 53 795 38 650 31 633 43 578 41 506 41 548 39…
Q: 8. Your unlucky friend Unlucky Louis just played the game and lost 15 points after 50 rolls! Just…
A: Given: x=15 z=0.3
Q: LEARNING COMPETENCY: The learners draw a conclusion about the population mean based on the…
A:
Q: Try these! A. Complete the Lower Boundary and Less than Cumulative Frequency of the table at the…
A: The values which divide a frequency distribution of a variable into four equal parts, are said to be…
Q: What is the Standard Deviation for the following numbers: Variance = 251
A: It is given that The variance is 251.
Q: Suppose that a company wishes to predict sales volume based on the amount of advertising…
A: Given : Estimated Sales Volume=46.67+0.46(Advertising Expenditures)
Q: A random sample of 200 adults showed that 80 are already fully vaccinated. a) What is the best point…
A: It is given that sample size (n) is 200 and x is 80.
Q: Class Interval 144-149 138-143 132-137 126-131 102 - 125 114-119 108-113 102-107 96 - 101 90-95…
A: Find D8 =?
Q: Eggs and poultry when not properly handled or undercooked are the most frequent reasons for…
A: The objective is to determine the approximate distribution of X where X is the monthly count of…
Q: What is the Sample Standard Deviation for the following numbers: 55, 96, 13, 57, 3
A: It is given that The data is 55, 96, 13, 57, 3 We know that The sample standard deviation is the…
Q: An environmentalist wants to determine the relationships between the numbers (in thousands) of…
A: The following information has been given: Number of fires (x) Number of acres burned (y) 72 62…
Q: 5. How would you generate a random sample from the statistical distribution given in the following…
A: Given information: x P(x) 0 14 1 12 2 14 Sum 1
Q: The football coach wants to test if a protein shake meal supplement will improve the performance of…
A: Disclaimer: Since you have posted a question with multiple sub-parts, we will solve the first three…
Q: A purple yam manufacturer claims that their containers contain 200 grams of yam. A random sample of…
A: According to the given information in this question There are four parts according to bartleby…
Q: The average weekly incomes, in £s, of 18 selected occupations in the United Kingdom were: 244, 146,…
A:
Q: A data set lists weights (lb) of plastic discarded by households. The highest weight is 5.56 lb, the…
A: Given X=5.56 X-bar=2.099 S=1.101
Q: A sample consists of the following n = 6 scores: 5, 5, 5, 8, 8, 8 Transform the distribution so that…
A: Distribution: A numerical dataset's distribution is the dispersion of the statistical information,…
Q: Determine the percent of the population for the following given that mu = 100 and sigma = 15 Draw a…
A:
Q: Find the F-test value given the ANOVA summary table below. Only the final answer should be…
A: The objective is to find out the F-test value from the given ANOVA table. Source SS d.f MSS F…
Q: The table represents the number of minutes of commercials during hour- long TV shows. Find the…
A: Given that Table for no. of minutes of commercials during hour long TV shows. No. of mins 12 13.5…
Q: For numbers 12-15, refer to the given problem below. Suppose that the percentage of female…
A: We have given that p = 0.27n = 120x = 45p̂ = x/n = 45/120 = 0.375α = 0.01 The null and alternative…
Q: Answer: #9 (mean of given #2) Direction: Complete the table below by finding the mean, median and m…
A: Note: as per the instruction I am answering subpart #9 of data set 2. Additionally, I have solved…
Q: 5. A multiple choice test has 5 questions. For a subject making random guesses for each answer, the…
A: Solution-: We have following probability distribution table: X P(X) 0 0.4096 1 0.4096 2…
Q: Suppose that A, B, C, D, and E are matrices with the following sizes: A B C D E (4x2) (4 × 6) (6×2)…
A: The order of matrix E is (2*4) The order of matrix A is (4*2)
Q: 4 she is afraid of gaining that 'freshman fifteen' she keeps hearing about. She has weighed herse…
A: SOCS is a useful acronym. It stands for: Shape Outliers center spread Range = Max-Min
Q: fast-food
A:
Q: Name Normal Distributions Worksheet (12-7) A set of data with a mean of 45 and a standard deviation…
A: Mean (μ)=45 Standard deviation (σ)=8.3

Step by step
Solved in 4 steps with 4 images

- Question 9 The relationship between annual salary (in US dollars) and race was estimated as below in a linear format. (White employees were coded as 0 and Non-White employees were coded as 1.) Annual Salary = -17,472 * Non-White + 48,253 (The p-value for the coefficient of Non-White is 0.01.) Base on the above equation, which of the following statements are true? A.) White employees are expected to receive 17,472 dollars more than non-white employees. B.) In the sample used to estimate the equation, the average pay of non-white employees is 17,472 dollars. C.)In the sample used to estimate the equation, the average pay of white employees is 30,781 dollars. D.)In the sample used to estimate the equation, the average pay of non-white employees is 48,253 dollars.Question 8 The relationship between annual salary (in US dollars) and race was estimated as below in a linear format. (White employees were coded as 0 and Non-White employees were coded as 1.) Annual Salary = -17,472 * Non-White + 48,253 (The p-value for the coefficient of Non-White is 0.01.) How can the relationship between race and annual salary be interpreted? A.) White employees are expected to receive 17,472 dollars more than non-white employees. B.) White employees are expected to receive 17,472 dollars less than non-white employees. C.)There is no meaningful difference in annual salary between white and non-white employees from a statistical point of view. D.) White employees are expected to receive 48,253 dollars more than non-white employees.Problem No. 5. Suppose a 10-item test in Math (x) and a 10-item test in English (y) were administered to 10 students. The scores of Student 1 to 10 are shown in the parenthesis, with x:y scores listed per student. (Student 1-4:5; Student 2-5:4; Student 3-9:8; Student 4- 2:3; Student 5- 8:9; Student 6- 1:2; Student 7- 2:1; Student 8- 7:6; Student 9- 6:7; Student 10- 4:5). Determine the correlation coefficient. *
- Question 4a. A large accountancy firm finds that over the long run 10% of its statements for clients are in error in some way. A quality assurance officer at the firm investigating the source of the errors takes a sample of 20 statements produced by a single employee and classifies each as being “in error” or “not in error”.i. If the variable X is used to represent the number of statements in the sample that are in error, and assuming the error rate is the firm’s level of 10% then state:• the type of distribution this variable has; and• the parameter/s of this distribution. ii. Determine the probability that 2 or less returns in this sample are in error. The quality assurance officer found that there were 5 statements in the sample that were in error.iii. Determine the probability of finding 5 or more returns in error if indeed the error rate was 10%. iv. Based upon your answer for part iii., what conclusion might the quality assurance office make about this employee in terms of the…Problem 1: A report states that on average Moroccan boys (12-18 years old) get a haircut 5.8 times a year. An independent researcher randomly selected 20 boys (12-18 years old) and obtained these data. 3 2 1 3 7 2 9 4 6 6 8 0 5 6 4 2 1 3 4 1 At α = 0.05, can it be concluded that the average is more than 5.8 visits per year? (Hint: use the t test)Problem 2. Last year, in a sample of 1200 randomly selected consumers who had opportunities to send in a rebate claim form after purchasing a product A, there are 300 of these people said they never did. This year, if a consumer sends in a rebate claim form, he will get 5 reward points. Observe 1000 randomly selected consumers who had opportunities to send in a rebate claim form after purchasing a product A this year, 200 of these people said they never did. a/ Does this data strongly suggest that the true proportion of such consumers who never apply for a rebate claim after purchasing the product A last year is greater than this year? Test the hypotheses at significance level 0.05 b/ Calculate an lower confidence bound at the 97% confidence level for the true proportion of such consumers who never apply for a rebate claim after purchasing the product A this year
- Is there a relationship between autism and what an infant is fed? To determine if there is, a researcher asked mothers of autistic and non-autistic children to say what they fed their infant. The data are in table below Feeding Autism Breastfeeding (B) Formula with DHA/ARA (FW) Formula without DHA/ARA (FO) Row Totals Yes 11 40 63 114 No 11 24 10 45 Column Totals 22 64 73 159 a) Since data were collected for variable(s), the correct graph to make is a b) Which of the following is the correct graph for the above data with Feeding grouped by Autism.A company that operated 10 hours a daymanufactures two products on threesequential processes. The following tablesummarizes the data for the problem:PROBLEM 1: The researcher would like to know whether academic performance of students in public school vary according to the board/visual aid used by teachers. For one quarter, different group of students were taught the same lessons using a glass board, white board, black board, and Manila paper. They took a 100-item quarterly test and following results were gathered: ACADEMIC PERFORMANCE OF STUDENTS USING GLASS BOARD ACADEMIC PERFORMANCE OF STUDENTS USING WHITE BOARD ACADEMIC PERFORMANCE OF STUDENTS USING BLACK BOARD ACADEMIC PERFORMANCE OF STUDENTS USING MANILA PAPER 96 90 87 87 84 87 88 79 89 90 86 89 83 95 88 98 85 95 86 97 82 97 85 96 89 96 87 70 90 95 86 73 95 90 87 74 96 90 86 75 Independent Variable: Dependent Variable: Experimental Design: Research Problems: (descriptive): (Inferential)…
- The National Highway Association is studying the relationship between the number of bidders on a highway project and the winning (lowest) bid for the project. Of particular interest is whether the number of bidders increases or decreases the amount of the winning bid. Bidders Price 9.0 5.1 9.0 8.0 3.0 9.7 10.0 7.8 5.0 7.7 10.0 5.5 7.0 8.3 11.0 5.5 6.0 10.3 6.0 8.0 4.0 8.8 7.0 9.4 7.0 8.6 7.0 8.1 6.0 7.8 Given: Correlation of Coefficient: 0.7064 (This is correct) Coefficient of determination: 49.90% (This is correct) ŷ = 11.2360 + (-0.4667)x (This is correct) Create a scatter plot of the data Complete a regression analysis of the relationship. Slope = ______ Estimate the winning bid if there were seven bidders. Winning bid cost ______ millions. Compute the 95% prediction interval for a winning bid if there are seven bidders. [ _____________, ______________]The National Highway Association is studying the relationship between the number of bidders on a highway project and the winning (lowest) bid for the project. Of particular interest is whether the number of bidders increases or decreases the amount of the winning bid. Bidders Price 9.0 5.1 9.0 8.0 3.0 9.7 10.0 7.8 5.0 7.7 10.0 5.5 7.0 8.3 11.0 5.5 6.0 10.3 6.0 8.0 4.0 8.8 7.0 9.4 7.0 8.6 7.0 8.1 6.0 7.8 GIVEN: correlation coefficient: - 0.7064 Slope: -0.4667 Coefficient of determination: 49.90% regression equation: ŷ= 11.2360 + (-4467)x FIND: Estimate the winning bid if there were seven bidders. Winning bid cost _________ millions. Explain. Compute the 95% prediction interval for a winning bid if there are seven bidders. [ _______________ , _______________ ] (Explain).Problem 1 A realtor wants to compare the mean sales-to-appraisal ratios of residential properties sold in four neighborhoods (A, B, C, and D). Four properties are randomly selected from each neighborhood and the ratios recorded for each, as shown below. A B C D 1.2 2.5 1 0.8 1.1 2.1 1.5 1.3 0.9 1.9 1.1 1.1 0.4 1.6 1.3 0.7 Answer the following question. For decimals, round to four decimal places. State the null hypothesis for this test. The grand mean for these observations is ____________ The SST for these observations is ____________ The SSA for these observations is ____________ The total degrees of freedom is _________________ The SSW is _________________ The within group mean square is _________________ The MSA is __________ At the 0.05 level of significance, the test statistic would be ________ The degrees of freedom are ________ Using α = 0.05, the critical value for this test would be ________…