Selected Stocks from the Dow Jones Industrial Average for a Day in 2015 52-week 52-week high Net YTD Symbol Open High Div Yield Name Low Close chg Chg Volume low PE %chg Apple APPL 113.84 115.01 113.61 115.01 1.73 1.51 41654100 134.54 92. 2.08 2.14 10.05 8.48 Boeing BA 141.13 146.45 141.05 145.41 5.09 3.5 6976300 158.83 115.02 4.36 3.63 15.8 0.56 International Business IBM 140.42 143.72 140.30 142.75 3.14 2.2 5583200 176.3 118. 5.20 4.17 9.16 3.59 Machines Johnson & JNJ 97.134 99.08 96.42 98.802 1.89 | 1.91 9887900 105.49 81.79 3.00 2.87 18.88 -3.97 Johnson General GE 28.74 29.52 28.70 29.36 0.72 2.47 81476400 31.49 19.37 0.92 3.16 16.97 -6.1 Electric Procter & PG 73.22 74.96 72.97 74.20 1.25 1.68 14080900 86.78 65.02 2.65 3.25 27.17 -6.09 Gamble


Dividend Valuation
Dividend refers to a reward or cash that a company gives to its shareholders out of the profits. Dividends can be issued in various forms such as cash payment, stocks, or in any other form as per the company norms. It is usually a part of the profit that the company shares with its shareholders.
Dividend Discount Model
Dividend payments are generally paid to investors or shareholders of a company when the company earns profit for the year, thus representing growth. The dividend discount model is an important method used to forecast the price of a company’s stock. It is based on the computation methodology that the present value of all its future dividends is equivalent to the value of the company.
Capital Gains Yield
It may be referred to as the earnings generated on an investment over a particular period of time. It is generally expressed as a percentage and includes some dividends or interest earned by holding a particular security. Cases, where it is higher normally, indicate the higher income and lower risk. It is mostly computed on an annual basis and is different from the total return on investment. In case it becomes too high, indicates that either the stock prices are going down or the company is paying higher dividends.
Stock Valuation
In simple words, stock valuation is a tool to calculate the current price, or value, of a company. It is used to not only calculate the value of the company but help an investor decide if they want to buy, sell or hold a company's stocks.
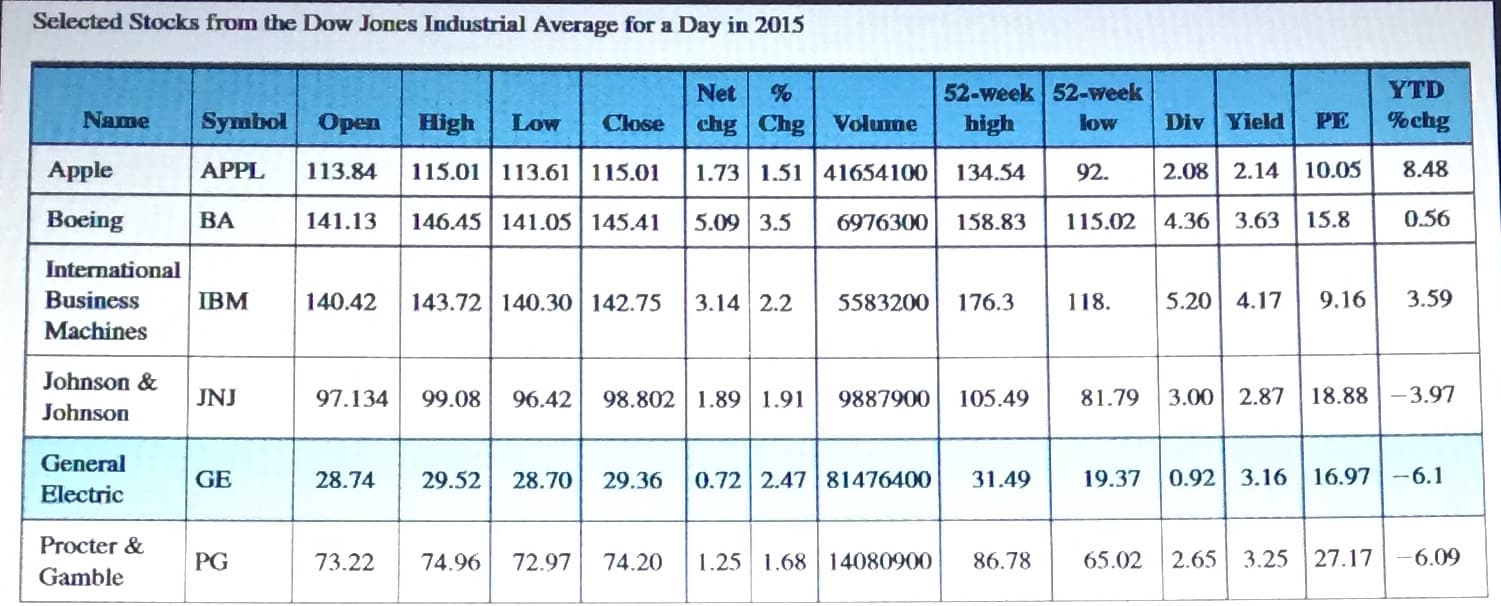
Use the given partial stock table. Round dollar amounts to the nearest cent when necessary.
Consider the following for Boeing (BA).
What is the difference between the highest and lowest prices paid for this stock during the last 52 weeks?
Suppose that you own 600 shares of this stock. What dividend do you receive this year?
How many shares of the stock were sold during the trading day?
Did the price of a share of this stock increase or decrease during the day shown in the table?
What was the price of a share of this stock at the start of the train day?


Trending now
This is a popular solution!

Step by step
Solved in 4 steps


