ses are beautifu fowers found threughout the United States, Canada, and northerm Europe. This problem concerns length of the sepal (leaf-ike part covering the fower) of dmerent species of wid irs. Data are besed on information taken from an artide by R.A Fisher in Annais of Eugenics (ve. 7. part 2, sp. 179-188). Measurements of sepal length in random samples of bs setesa (). Dris versicolor (I), and Iris virginica () are as follows below. ethere are no diferences among the population means of sepal length for the dferent species of irs Use a 10 level of significance. lof significance State emate hypotheses H A three means are diferent. M Exactly two means equal OM least two means are equal OM - : H: Not all the means are (D) Find SSgp SSen and SS, and check that SSor SSer+ SS (Use 3 decimal places.) Find dan d MSn and MS (Ue 4 decimal places for MS and MS Find the value of the samplestatistic. (Use 2 decimal places.) what are the degrees of (numerator) (denominator) () Find the Pvalue of the sample test statistic. (Use 4 decimal places.) O
ses are beautifu fowers found threughout the United States, Canada, and northerm Europe. This problem concerns length of the sepal (leaf-ike part covering the fower) of dmerent species of wid irs. Data are besed on information taken from an artide by R.A Fisher in Annais of Eugenics (ve. 7. part 2, sp. 179-188). Measurements of sepal length in random samples of bs setesa (). Dris versicolor (I), and Iris virginica () are as follows below. ethere are no diferences among the population means of sepal length for the dferent species of irs Use a 10 level of significance. lof significance State emate hypotheses H A three means are diferent. M Exactly two means equal OM least two means are equal OM - : H: Not all the means are (D) Find SSgp SSen and SS, and check that SSor SSer+ SS (Use 3 decimal places.) Find dan d MSn and MS (Ue 4 decimal places for MS and MS Find the value of the samplestatistic. (Use 2 decimal places.) what are the degrees of (numerator) (denominator) () Find the Pvalue of the sample test statistic. (Use 4 decimal places.) O

Functions and Change: A Modeling Approach to College Algebra (MindTap Course List)
6th Edition
ISBN:9781337111348
Author:Bruce Crauder, Benny Evans, Alan Noell
Publisher:Bruce Crauder, Benny Evans, Alan Noell
Chapter5: A Survey Of Other Common Functions
Section5.3: Modeling Data With Power Functions
Problem 6E: Urban Travel Times Population of cities and driving times are related, as shown in the accompanying...

Related questions
Question
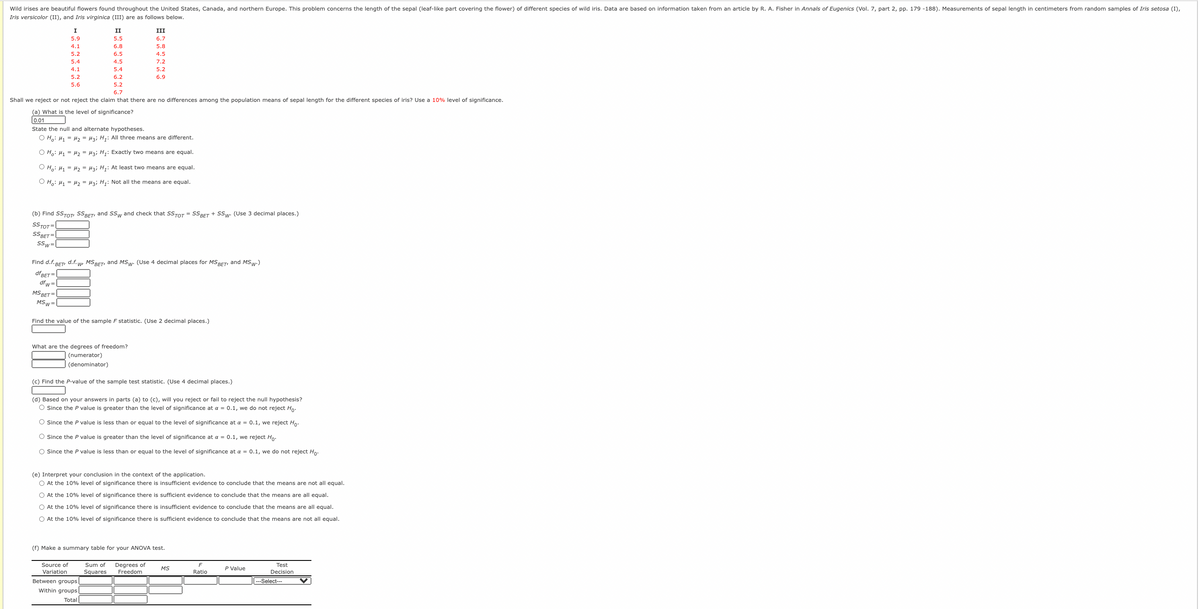
Transcribed Image Text:Wild irises are beautiful flowers found throughout the United States, Canada, and northern Europe. This problem concerns the length of the sepal (leaf-like part covering the flower) of different species of wild iris. Data are based on information taken from an article by R. A. Fisher in Annals of Eugenics (Vol. 7, part 2, pp. 179 -188). Measurements of sepal length in centimeters from random samples of Iris setosa (I),
Iris versicolor (II), and Iris virginica (III) are as follows below.
I
II
III
5.9
5.5
6.7
4.1
6.8
5.8
5.2
6.5
4.5
5.4
4.5
7.2
4.1
5.4
5.2
5.2
6.2
6.9
5.6
5.2
6.7
Shall we reject or not reject the claim that there are no differences among the population means of sepal length for the different species of iris? Use a 10% level of significance.
(a) What is the level of significance?
0.01
State the null and alternate hypotheses.
O H,: H1 = H, = Hzi H;: All three means are different.
O H,: H1 = H2 = Hzi H;: Exactly two means are equal.
O H,: H, = H2 = Hai H,: At least two means are equal.
O H.: H1 = H2 = H3; H;: Not all the means are equal.
(b) Find SSTOT, SSBET, and SSw and check that SSTOT = SSBET + Ssw. (Use 3 decimal places.)
SSTOT=
SSBET =
SSw
Find d.f. BET d.f. w, MSBET, and MSw. (Use 4 decimal places for MSBET, and MSw-)
dfBET =
dfw =
MS BET=
MSw=
Find the value of the sample F statistic. (Use 2 decimal places.)
What are the degrees of freedom?
(numerator)
(denominator)
(c) Find the P-value of the sample test statistic. (Use 4 decimal places.)
(d) Based on your answers in parts (a) to (c), will you reject or fail to reject the null hypothesis?
O Since the P value is greater than the level of significance at a = 0.1, we do not reject Ho:
O Since the P value is less than or equal to the level of significance at a = 0.1, we reject Ho.
O Since the P value is greater than the level of significance at a = 0.1, we reject Ho.
O Since the P value is less than or equal to the level of significance at a = 0.1, we do not reject Ho:
(e) Interpret your conclusion in the context of the application.
O At the 10% level of significance there is insufficient evidence to conclude that the means are not all equal.
O At the 10% level of significance there is sufficient evidence to conclude that the means are all equal.
O At the 10% level of significance there is insufficient evidence to conclude that the means are all equal.
O At the 10% level of significance there is sufficient evidence to conclude that the means are not all equal.
(f) Make a summary table for
ANOVA test.
Degrees of
Freedom
Source of
Sum of
Test
Decision
MS
P Value
Variation
Squares
Ratio
Between groups
--Select---
Within groups
Total
Expert Solution
This question has been solved!
Explore an expertly crafted, step-by-step solution for a thorough understanding of key concepts.

Step by step
Solved in 5 steps

Recommended textbooks for you
Functions and Change: A Modeling Approach to Coll…
Algebra
ISBN:
9781337111348
Author:
Bruce Crauder, Benny Evans, Alan Noell
Publisher:
Cengage Learning

Glencoe Algebra 1, Student Edition, 9780079039897…
Algebra
ISBN:
9780079039897
Author:
Carter
Publisher:
McGraw Hill

Big Ideas Math A Bridge To Success Algebra 1: Stu…
Algebra
ISBN:
9781680331141
Author:
HOUGHTON MIFFLIN HARCOURT
Publisher:
Houghton Mifflin Harcourt
Functions and Change: A Modeling Approach to Coll…
Algebra
ISBN:
9781337111348
Author:
Bruce Crauder, Benny Evans, Alan Noell
Publisher:
Cengage Learning
Glencoe Algebra 1, Student Edition, 9780079039897…
Algebra
ISBN:
9780079039897
Author:
Carter
Publisher:
McGraw Hill
Big Ideas Math A Bridge To Success Algebra 1: Stu…
Algebra
ISBN:
9781680331141
Author:
HOUGHTON MIFFLIN HARCOURT
Publisher:
Houghton Mifflin Harcourt