Several months ago while shopping, I was interviewed to see whether or not I'd be interested in signing up for a subscription to a yoga app. I fall into the category of people who have a membership at a local gym, and guessed that, like me, many people in that category would not be interested in the app. My friend Yoko falls in the category of people who do not have a membership at a local gym, and I was thinking that she might like a subscription to the app. After being interviewed, I looked at the interviewer's results. Of the 97 people in my market category who had been interviewed, 20 said they would buy a subscription, and of the 114 people in Yoko's market category, 32 said they would buy a subscription. Assuming that these data came from independent, random samples, can we conclude, at the 0.05 level of significance, that the proportion p, of all mall shoppers in my market category who would buy a subscription is less than the proportion p, of all mall shoppers in Yoko's market category who would a subscription? Perform a one-tailed test. Then complete the parts below. Carry your intermediate computations to three or more decimal places and round your answers as specified in the parts below. (If necessary, consult a list of formulac)
Several months ago while shopping, I was interviewed to see whether or not I'd be interested in signing up for a subscription to a yoga app. I fall into the category of people who have a membership at a local gym, and guessed that, like me, many people in that category would not be interested in the app. My friend Yoko falls in the category of people who do not have a membership at a local gym, and I was thinking that she might like a subscription to the app. After being interviewed, I looked at the interviewer's results. Of the 97 people in my market category who had been interviewed, 20 said they would buy a subscription, and of the 114 people in Yoko's market category, 32 said they would buy a subscription. Assuming that these data came from independent, random samples, can we conclude, at the 0.05 level of significance, that the proportion p, of all mall shoppers in my market category who would buy a subscription is less than the proportion p, of all mall shoppers in Yoko's market category who would a subscription? Perform a one-tailed test. Then complete the parts below. Carry your intermediate computations to three or more decimal places and round your answers as specified in the parts below. (If necessary, consult a list of formulac)

Linear Algebra: A Modern Introduction
4th Edition
ISBN:9781285463247
Author:David Poole
Publisher:David Poole
Chapter2: Systems Of Linear Equations
Section2.4: Applications
Problem 28EQ

Related questions
Question
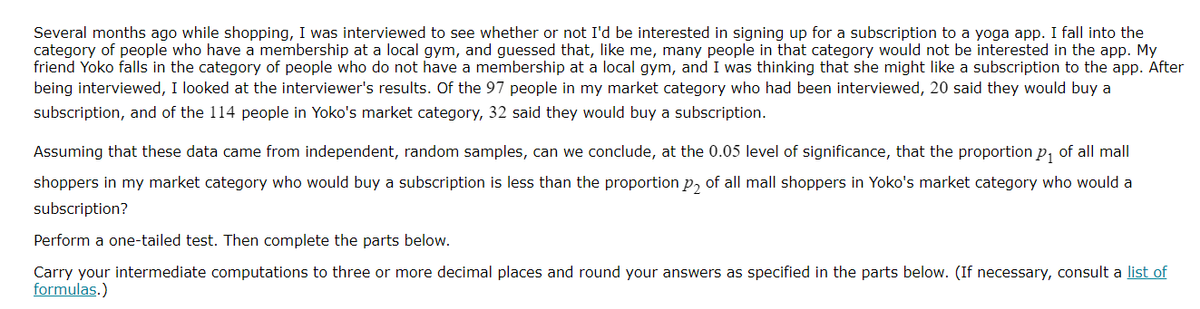
Transcribed Image Text:Several months ago while shopping, I was interviewed to see whether or not I'd be interested in signing up for a subscription to a yoga app. I fall into the
category of people who have a membership at a local gym, and guessed that, like me, many people in that category would not be interested in the app. My
friend Yoko falls in the category of people who do not have a membership at a local gym, and I was thinking that she might like a subscription to the app. After
being interviewed, I looked at the interviewer's results. Of the 97 people in my market category who had been interviewed, 20 said they would buy a
subscription, and of the 114 people in Yoko's market category, 32 said they would buy a subscription.
Assuming that these data came from independent, random samples, can we conclude, at the 0.05 level of significance, that the proportion p, of all mall
shoppers in my market category who would buy a subscription is less than the proportion p, of all mall shoppers in Yoko's market category who would a
subscription?
Perform a one-tailed test. Then complete the parts below.
Carry your intermediate computations to three or more decimal places and round your answers as specified in the parts below. (If necessary, consult a list of
formulas.)
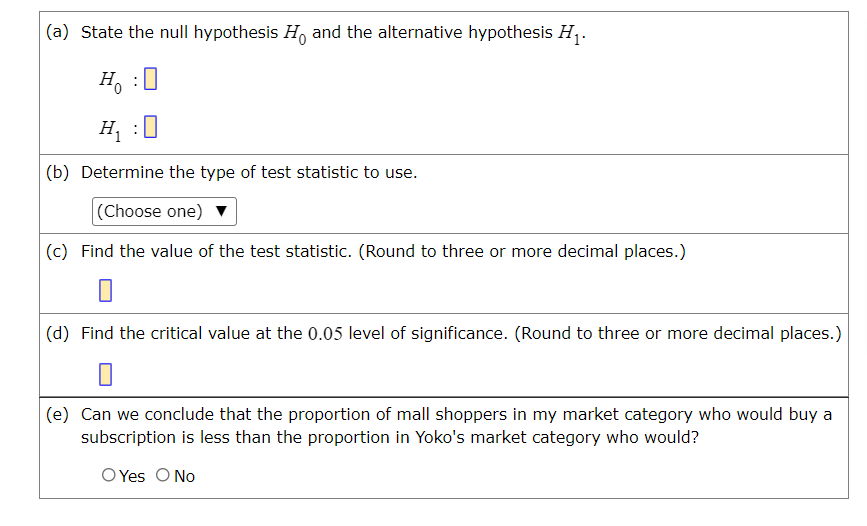
Transcribed Image Text:(a) State the null hypothesis H, and the alternative hypothesis H,.
H :0
H, :0
(b) Determine the type of test statistic to use.
|(Choose one)
(c) Find the value of the test statistic. (Round to three or more decimal places.)
(d) Find the critical value at the 0.05 level of significance. (Round to three or more decimal places.)
(e) Can we conclude that the proportion of mall shoppers in my market category who would buy a
subscription is less than the proportion in Yoko's market category who would?
O Yes O No
Expert Solution
This question has been solved!
Explore an expertly crafted, step-by-step solution for a thorough understanding of key concepts.

This is a popular solution!

Trending now
This is a popular solution!

Step by step
Solved in 3 steps

Recommended textbooks for you
Linear Algebra: A Modern Introduction
Algebra
ISBN:
9781285463247
Author:
David Poole
Publisher:
Cengage Learning

Trigonometry (MindTap Course List)
Trigonometry
ISBN:
9781305652224
Author:
Charles P. McKeague, Mark D. Turner
Publisher:
Cengage Learning

College Algebra
Algebra
ISBN:
9781305115545
Author:
James Stewart, Lothar Redlin, Saleem Watson
Publisher:
Cengage Learning
Linear Algebra: A Modern Introduction
Algebra
ISBN:
9781285463247
Author:
David Poole
Publisher:
Cengage Learning
Trigonometry (MindTap Course List)
Trigonometry
ISBN:
9781305652224
Author:
Charles P. McKeague, Mark D. Turner
Publisher:
Cengage Learning
College Algebra
Algebra
ISBN:
9781305115545
Author:
James Stewart, Lothar Redlin, Saleem Watson
Publisher:
Cengage Learning

Algebra: Structure And Method, Book 1
Algebra
ISBN:
9780395977224
Author:
Richard G. Brown, Mary P. Dolciani, Robert H. Sorgenfrey, William L. Cole
Publisher:
McDougal Littell