Several years ago, the mean height of women 20 years of age or older was 63.7 inches. Suppose that a random sample of 45 women who are 20 years of age or older today results in a mean height of 64.5 inches. (a) State the appropriate null and alternative hypotheses to assess whether women are taller today. (b) Suppose the P-value for this test is 0.01. Explain what this value represents. (c) Write a conclusion for this hypothesis test assuming an a = 0.10 level of significance. (a) State the appropriate null and alternative hypotheses to assess whether women are taller today. O A. H, u= 63.7 in. versus H,: u# 63.7 in. O B. Ho: u= 63.7 in. versus H,: u> 63.7 in. OC. Ho u= 64.5 in. versus H,: u < 64.5 in. O D. Ho: u= 63.7 in. versus H,: u< 63.7 in. O E. H u= 64.5 in. versus H,: u> 64.5 in. OF. Ha H= 64.5 in. versus H,: u# 64.5 in. (b) Suppose the P-value for this test is 0.01. Explain what this value represents. O A. There is a 0.01 probability of obtaining a sample mean height of exactly 64.5 inches from a population whose mean height is 63.7 inches. O B. There is a 0.01 probability of obtaining a sample mean height of 64.5 inches or shorter from a population whose mean height is 63.7 inches. OC. There is a 0.01 probability of obtaining a sample mean height of 64.5 inches or taller from a population whose mean height is 63.7 inches. O D. There is a 0.01 probability of obtaining a sample mean height of 63.7 inches or taller from a population whose mean height is 64.5 inches. (c) Write a conclusion for this hypothesis test assuming an a = 0.10 level of significance.
Several years ago, the mean height of women 20 years of age or older was 63.7 inches. Suppose that a random sample of 45 women who are 20 years of age or older today results in a mean height of 64.5 inches. (a) State the appropriate null and alternative hypotheses to assess whether women are taller today. (b) Suppose the P-value for this test is 0.01. Explain what this value represents. (c) Write a conclusion for this hypothesis test assuming an a = 0.10 level of significance. (a) State the appropriate null and alternative hypotheses to assess whether women are taller today. O A. H, u= 63.7 in. versus H,: u# 63.7 in. O B. Ho: u= 63.7 in. versus H,: u> 63.7 in. OC. Ho u= 64.5 in. versus H,: u < 64.5 in. O D. Ho: u= 63.7 in. versus H,: u< 63.7 in. O E. H u= 64.5 in. versus H,: u> 64.5 in. OF. Ha H= 64.5 in. versus H,: u# 64.5 in. (b) Suppose the P-value for this test is 0.01. Explain what this value represents. O A. There is a 0.01 probability of obtaining a sample mean height of exactly 64.5 inches from a population whose mean height is 63.7 inches. O B. There is a 0.01 probability of obtaining a sample mean height of 64.5 inches or shorter from a population whose mean height is 63.7 inches. OC. There is a 0.01 probability of obtaining a sample mean height of 64.5 inches or taller from a population whose mean height is 63.7 inches. O D. There is a 0.01 probability of obtaining a sample mean height of 63.7 inches or taller from a population whose mean height is 64.5 inches. (c) Write a conclusion for this hypothesis test assuming an a = 0.10 level of significance.

Chapter9: Sequences, Probability And Counting Theory
Section9.7: Probability
Problem 1SE: What term is used to express the likelihood of an event occurring? Are there restrictions on its...

Related questions
Question
10
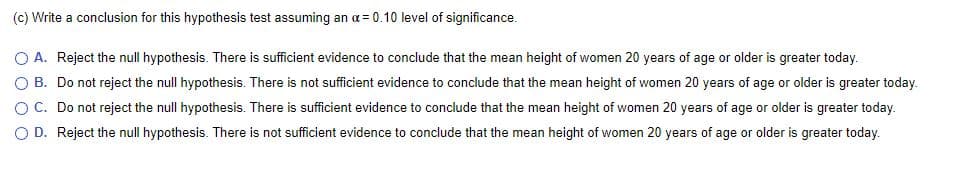
Transcribed Image Text:(c) Write a conclusion for this hypothesis test assuming an a= 0.10 level of significance.
O A. Reject the null hypothesis. There is sufficient evidence to conclude that the mean height of women 20 years of age or older is greater today.
O B. Do not reject the null hypothesis. There is not sufficient evidence to conclude that the mean height of women 20 years of age or older is greater today.
O C. Do not reject the null hypothesis. There is sufficient evidence to conclude that the mean height of women 20 years of age or older is greater today.
O D. Reject the null hypothesis. There is not sufficient evidence to conclude that the mean height of women 20 years of age or older is greater today.
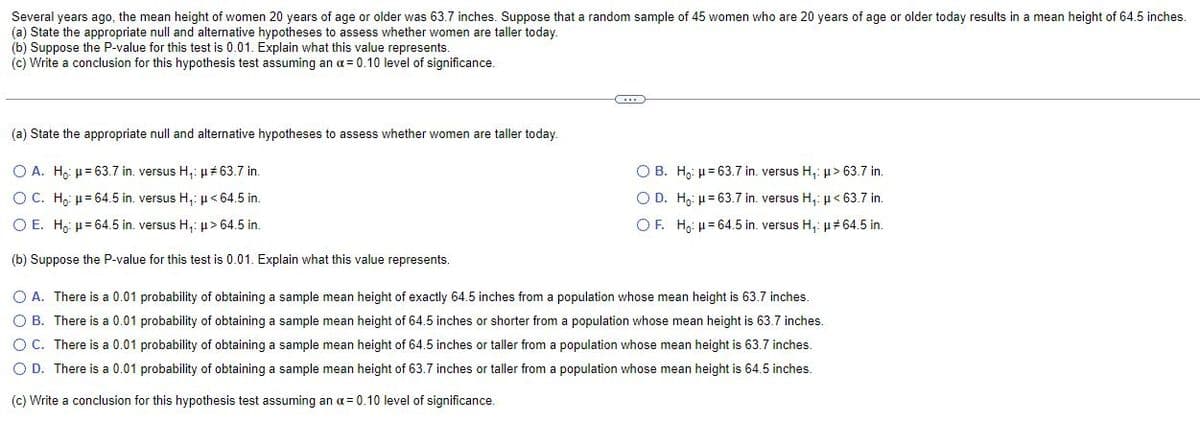
Transcribed Image Text:Several years ago, the mean height of women 20 years of age or older was 63.7 inches. Suppose that a random sample of 45 women who are 20 years of age or older today results in a mean height of 64.5 inches.
(a) State the appropriate null and alternative hypotheses to assess whether women are taller today.
(b) Suppose the P-value for this test is 0.01. Explain what this value represents.
(c) Write a conclusion for this hypothesis test assuming an a = 0.10 level of significance.
(a) State the appropriate null and alternative hypotheses to assess whether women are taller today.
O A. H,: µ= 63.7 in. versus H,: µ 63.7 in.
O B. H,: µ= 63.7 in. versus H,: µ> 63.7 in.
O C. H: µ= 64.5 in. versus H,: µ< 64.5 in.
O D. H,: µ= 63.7 in. versus H,: µ< 63.7 in.
O E. H,: µ= 64.5 in. versus H,: µ> 64.5 in.
OF. Ho: H= 64.5 in. versus H,: µ#64.5 in.
(b) Suppose the P-value for this test is 0.01. Explain what this value represents.
O A. There is a 0.01 probability of obtaining a sample mean height of exactly 64.5 inches from a population whose mean height is 63.7 inches.
O B. There is a 0.01 probability of obtaining a sample mean height of 64.5 inches or shorter from a population whose mean height is 63.7 inches.
OC. There is a 0.01 probability of obtaining a sample mean height of 64.5 inches or taller from a population whose mean height is 63.7 inches.
O D. There is a 0.01 probability of obtaining a sample mean height of 63.7 inches or taller from a population whose mean height is 64.5 inches.
(c) Write a conclusion for this hypothesis test assuming an a= 0.10 level of significance.
Expert Solution
This question has been solved!
Explore an expertly crafted, step-by-step solution for a thorough understanding of key concepts.

This is a popular solution!

Trending now
This is a popular solution!

Step by step
Solved in 4 steps with 1 images

Recommended textbooks for you