show step by step and answer all questions The 102 highway has a posted speed limit of 70 miles per hour on the stretch from San Francisco to Bay Area. For a single week, the highway patrol set up a hidden radar gun to measure how many cars break the speed limit after having numerous reports of accidents on this stretch of highway. The highway patrol needs to put together an action plan if the annual proportion of vehicles who break the speed limit is over 9%. However, they could only set up the radar gun for one week. Question-The sampling method used for this situation would most likely be considered 'convenience sampling.' Find a potential fault, bais, or hidden variable in the way this sample was conducted that might skew the results. -What is the sample size,What is the proportion of vehicles who broke the speed limit over this 1 week period from Bay Area to San Francisco? -Construct a 90% confidence interval for the proportion of vehicles who break the speed limit annually. -Is it possible that the annual number of vehicles who break the speed limit is over 9%? Explain why or why not. -Construct a 99% confidence interval for the proportion of vehicles who break the speed limit annually.


Continuous Probability Distributions
Probability distributions are of two types, which are continuous probability distributions and discrete probability distributions. A continuous probability distribution contains an infinite number of values. For example, if time is infinite: you could count from 0 to a trillion seconds, billion seconds, so on indefinitely. A discrete probability distribution consists of only a countable set of possible values.
Normal Distribution
Suppose we had to design a bathroom weighing scale, how would we decide what should be the range of the weighing machine? Would we take the highest recorded human weight in history and use that as the upper limit for our weighing scale? This may not be a great idea as the sensitivity of the scale would get reduced if the range is too large. At the same time, if we keep the upper limit too low, it may not be usable for a large percentage of the population!
show step by step and answer all questions
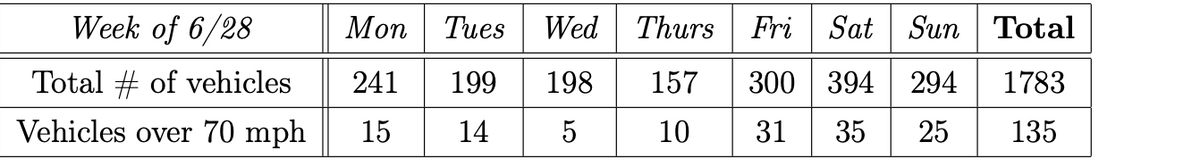
The 102 highway has a posted speed limit of 70 miles per hour on the stretch from San Francisco to Bay Area. For a single week, the highway patrol set up a hidden radar gun to measure how many cars break the speed limit after having numerous reports of accidents on this stretch of highway.
The highway patrol needs to put together an action plan if the annual
proportion of vehicles who break the speed limit is over 9%. However, they could only set up the radar gun for one week.
Question-The sampling method used for this situation would most likely be considered 'convenience sampling.' Find a potential fault, bais, or hidden variable in the way this sample was conducted that might skew the results.
-What is the sample size,What is the proportion of vehicles who broke the speed limit over this 1 week period from Bay Area to San Francisco?
-Construct a 90% confidence interval for the proportion of vehicles who break the speed limit annually.
-Is it possible that the annual number of vehicles who break the speed limit is over 9%? Explain why or why not.
-Construct a 99% confidence interval for the proportion of vehicles who break the speed limit annually.

Step by step
Solved in 2 steps


