Simple Regression Sales Revenue Year Product Price (P) (millions of pesos) 1 1.20 0.95 1.50 0.93 2.00 0.92 4 3.50 0.90 5 4.10 0.87 5.60 0.85 Let Sales Revenue be (v) and Product Price be (x) If the Company intends plans to decrease the product price to PO.82 next year, use simple linear regression to forecast next year's sales revenue. O P43.2112 O P6.6944 O P5.4200 O P44.5327 2.
Simple Regression Sales Revenue Year Product Price (P) (millions of pesos) 1 1.20 0.95 1.50 0.93 2.00 0.92 4 3.50 0.90 5 4.10 0.87 5.60 0.85 Let Sales Revenue be (v) and Product Price be (x) If the Company intends plans to decrease the product price to PO.82 next year, use simple linear regression to forecast next year's sales revenue. O P43.2112 O P6.6944 O P5.4200 O P44.5327 2.

Functions and Change: A Modeling Approach to College Algebra (MindTap Course List)
6th Edition
ISBN:9781337111348
Author:Bruce Crauder, Benny Evans, Alan Noell
Publisher:Bruce Crauder, Benny Evans, Alan Noell
Chapter3: Straight Lines And Linear Functions
Section3.CR: Chapter Review Exercises
Problem 15CR: Life Expectancy The following table shows the average life expectancy, in years, of a child born in...

Related questions
Question
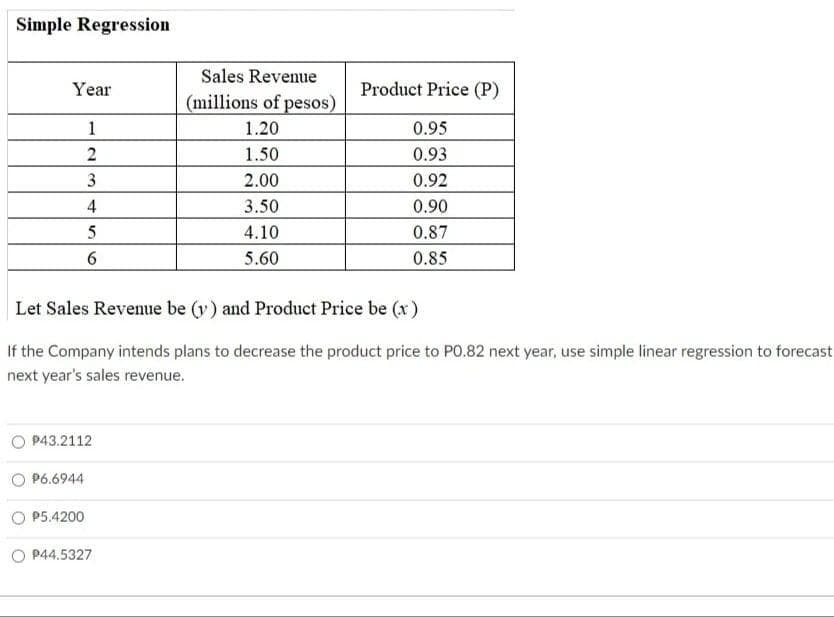
Transcribed Image Text:Simple Regression
Sales Revenue
Year
Product Price (P)
(millions of pesos)
1
1.20
0.95
1.50
0.93
3
2.00
0.92
4
3.50
0.90
4.10
0.87
5.60
0.85
Let Sales Revenue be (v) and Product Price be (x)
If the Company intends plans to decrease the product price to PO.82 next year, use simple linear regression to forecast
next year's sales revenue.
P43.2112
P6.6944
P5.4200
P44.5327
2.
Expert Solution
This question has been solved!
Explore an expertly crafted, step-by-step solution for a thorough understanding of key concepts.

Step by step
Solved in 2 steps with 1 images

Recommended textbooks for you
Functions and Change: A Modeling Approach to Coll…
Algebra
ISBN:
9781337111348
Author:
Bruce Crauder, Benny Evans, Alan Noell
Publisher:
Cengage Learning

Glencoe Algebra 1, Student Edition, 9780079039897…
Algebra
ISBN:
9780079039897
Author:
Carter
Publisher:
McGraw Hill

Algebra and Trigonometry (MindTap Course List)
Algebra
ISBN:
9781305071742
Author:
James Stewart, Lothar Redlin, Saleem Watson
Publisher:
Cengage Learning
Functions and Change: A Modeling Approach to Coll…
Algebra
ISBN:
9781337111348
Author:
Bruce Crauder, Benny Evans, Alan Noell
Publisher:
Cengage Learning
Glencoe Algebra 1, Student Edition, 9780079039897…
Algebra
ISBN:
9780079039897
Author:
Carter
Publisher:
McGraw Hill
Algebra and Trigonometry (MindTap Course List)
Algebra
ISBN:
9781305071742
Author:
James Stewart, Lothar Redlin, Saleem Watson
Publisher:
Cengage Learning

College Algebra
Algebra
ISBN:
9781305115545
Author:
James Stewart, Lothar Redlin, Saleem Watson
Publisher:
Cengage Learning