Sketch a typical isoquant for a healthcare outcome, say “population mental health”. The inputs used to produce this output are “therapists” and “drugs”. Draw representative isocost lines and indicate the least-cost combination of inputs to achieve the output level represented by the isoquant. Illustrate what would happen if the price of therapists increased. Did the least-cost input combination change? In what way? That is, are you using more therapists after the price change or less? What happened to the use of drugs?
Sketch a typical isoquant for a healthcare outcome, say “population mental health”. The inputs used to produce this output are “therapists” and “drugs”. Draw representative isocost lines and indicate the least-cost combination of inputs to achieve the output level represented by the isoquant. Illustrate what would happen if the price of therapists increased. Did the least-cost input combination change? In what way? That is, are you using more therapists after the price change or less? What happened to the use of drugs?

Managerial Economics: Applications, Strategies and Tactics (MindTap Course List)
14th Edition
ISBN:9781305506381
Author:James R. McGuigan, R. Charles Moyer, Frederick H.deB. Harris
Publisher:James R. McGuigan, R. Charles Moyer, Frederick H.deB. Harris
Chapter8: Cost Analysis
Section: Chapter Questions
Problem 9E

Related questions
Question
APPLICATION
Sketch a typical isoquant for a healthcare outcome, say “population mental health”. The inputs used to produce this output are “therapists” and “drugs”. Draw representative isocost lines and indicate the least-cost combination of inputs to achieve the output level represented by the isoquant. Illustrate what would happen if the price of therapists increased. Did the least-cost input combination change? In what way? That is, are you using more therapists after the price change or less? What happened to the use of drugs?
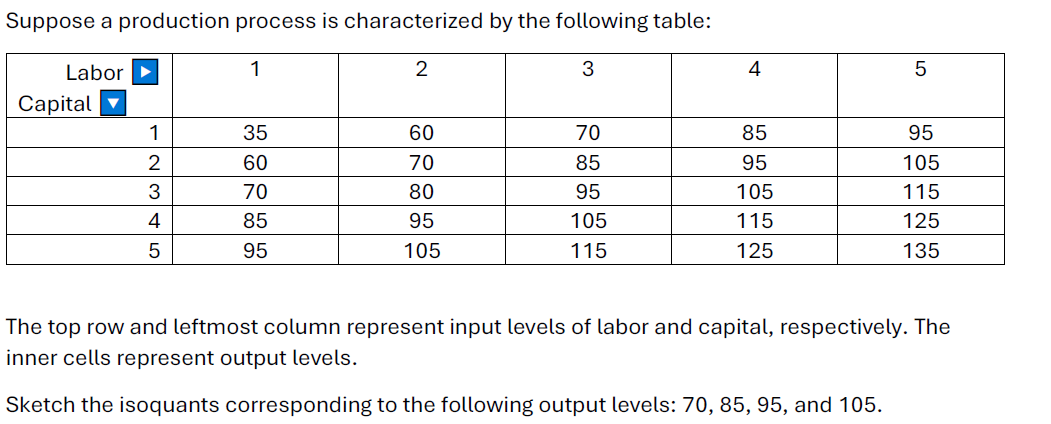
Transcribed Image Text:Suppose a production process is characterized by the following table:
1
3
Labor
Capital
1
2
3
4
5
35
60
70
85
95
2
60
70
80
95
105
70
85
95
105
115
4
85
95
105
115
125
5
95
105
115
125
135
The top row and leftmost column represent input levels of labor and capital, respectively. The
inner cells represent output levels.
Sketch the isoquants corresponding to the following output levels: 70, 85, 95, and 105.
Expert Solution
This question has been solved!
Explore an expertly crafted, step-by-step solution for a thorough understanding of key concepts.

Step by step
Solved in 3 steps with 4 images

Knowledge Booster


Learn more about
Need a deep-dive on the concept behind this application? Look no further. Learn more about this topic, economics and related others by exploring similar questions and additional content below.Recommended textbooks for you
Managerial Economics: Applications, Strategies an…
Economics
ISBN:
9781305506381
Author:
James R. McGuigan, R. Charles Moyer, Frederick H.deB. Harris
Publisher:
Cengage Learning

Principles of Economics 2e
Economics
ISBN:
9781947172364
Author:
Steven A. Greenlaw; David Shapiro
Publisher:
OpenStax

Essentials of Economics (MindTap Course List)
Economics
ISBN:
9781337091992
Author:
N. Gregory Mankiw
Publisher:
Cengage Learning
Managerial Economics: Applications, Strategies an…
Economics
ISBN:
9781305506381
Author:
James R. McGuigan, R. Charles Moyer, Frederick H.deB. Harris
Publisher:
Cengage Learning
Principles of Economics 2e
Economics
ISBN:
9781947172364
Author:
Steven A. Greenlaw; David Shapiro
Publisher:
OpenStax
Essentials of Economics (MindTap Course List)
Economics
ISBN:
9781337091992
Author:
N. Gregory Mankiw
Publisher:
Cengage Learning

