Sketch the function y = x + 5, and use it as directed below. (a) Sketch the function and draw the line between the points on the curve at x = 1 and x = 2. What is its slope? (b) Sketch the function and draw the line between the points on the curve at x = 1 and x = 1.5. What is its slope? (c) Sketch the function and draw what you imagine would be the tangent line to the curve at x = 1 (touches the curve at just that point). Step 1 of 5 (a) Sketch the function and draw the line between the points on the curve at x = 1 and x = 2. What is its slope? The function y = x2 + 5 is a parabola that opens --Select--- with vertex at (х, у) %3D Fill in the following table evaluating y = f(x) at x = 1 and x = 2. y = f(x) 1 2 Graph y = f(x) by plotting the vertex and the points from the table, then draw the line through the two points from the table. 10 Graph Layers After you add an object to the graph you can use Graph Layers to view and edit its properties. Fill No Solution O Help WebAssign. Graphing Tool
Sketch the function y = x + 5, and use it as directed below. (a) Sketch the function and draw the line between the points on the curve at x = 1 and x = 2. What is its slope? (b) Sketch the function and draw the line between the points on the curve at x = 1 and x = 1.5. What is its slope? (c) Sketch the function and draw what you imagine would be the tangent line to the curve at x = 1 (touches the curve at just that point). Step 1 of 5 (a) Sketch the function and draw the line between the points on the curve at x = 1 and x = 2. What is its slope? The function y = x2 + 5 is a parabola that opens --Select--- with vertex at (х, у) %3D Fill in the following table evaluating y = f(x) at x = 1 and x = 2. y = f(x) 1 2 Graph y = f(x) by plotting the vertex and the points from the table, then draw the line through the two points from the table. 10 Graph Layers After you add an object to the graph you can use Graph Layers to view and edit its properties. Fill No Solution O Help WebAssign. Graphing Tool

Big Ideas Math A Bridge To Success Algebra 1: Student Edition 2015
1st Edition
ISBN:9781680331141
Author:HOUGHTON MIFFLIN HARCOURT
Publisher:HOUGHTON MIFFLIN HARCOURT
Chapter10: Radical Functions And Equations
Section: Chapter Questions
Problem 15CT

Related questions
Question
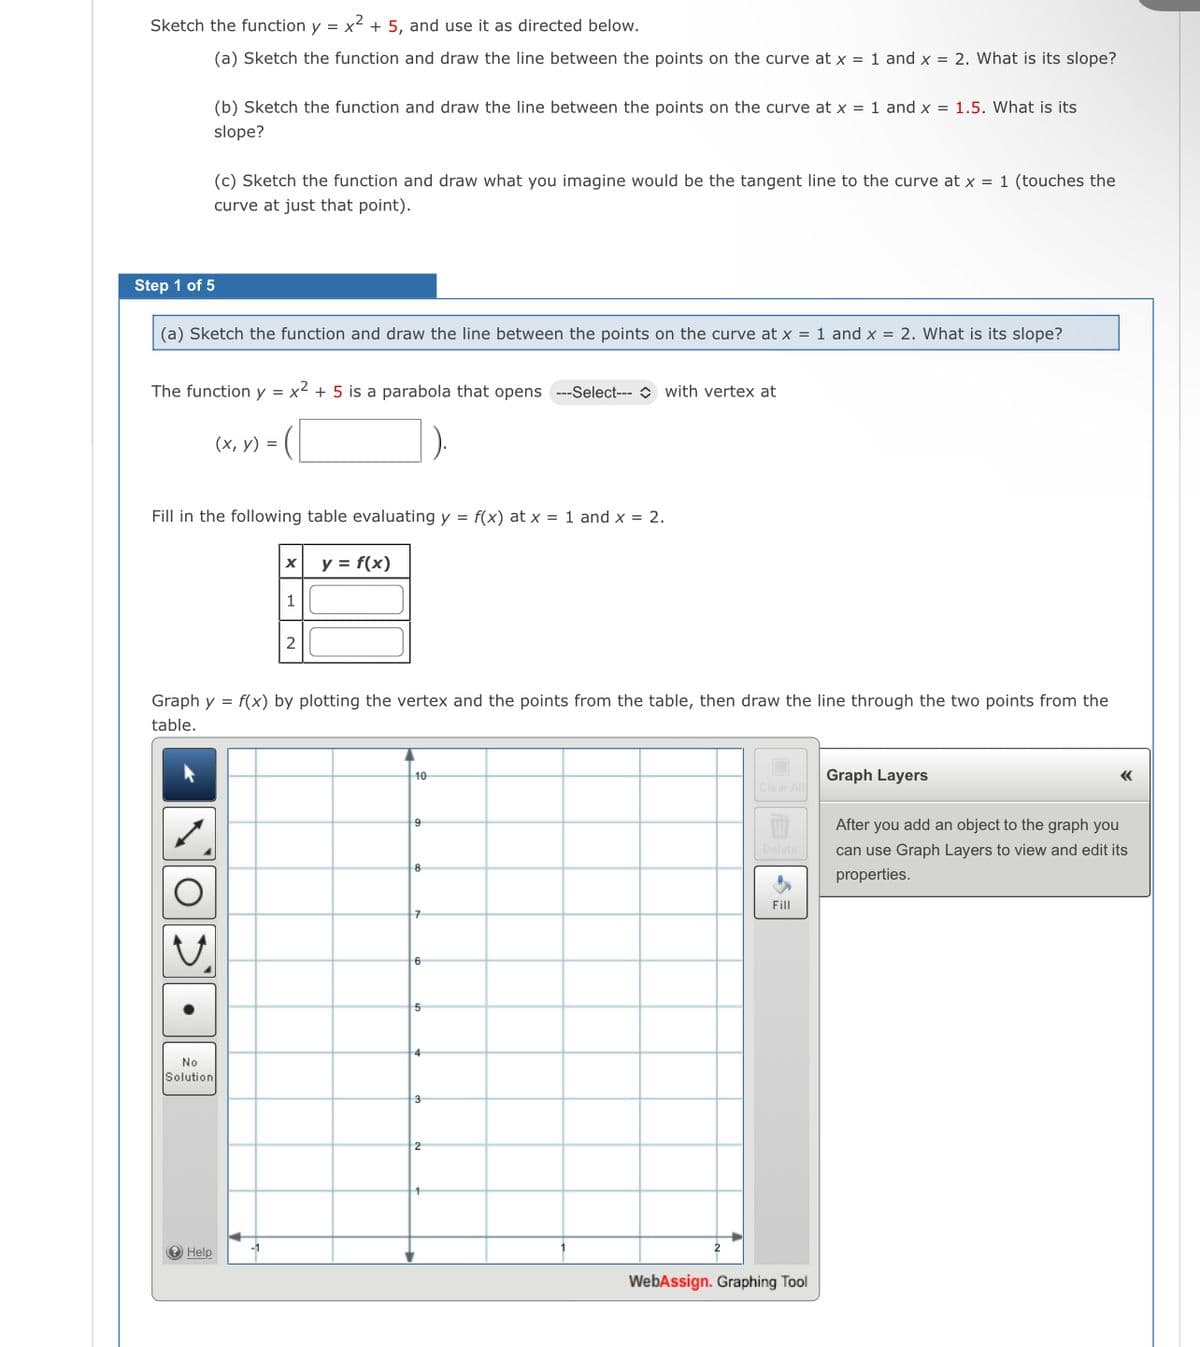
Transcribed Image Text:Sketch the function y = x² + 5, and use it as directed below.
(a) Sketch the function and draw the line between the points on the curve at x = 1 and x = 2. What is its slope?
(b) Sketch the function and draw the line between the points on the curve at x = 1 and x = 1.5. What is its
slope?
(c) Sketch the function and draw what you imagine would be the tangent line to the curve at x = 1 (touches the
curve at just that point).
Step 1 of 5
(a) Sketch the function and draw the line between the points on the curve at x = 1 and x = 2. What is its slope?
The function y = x2 + 5 is a parabola that opens --Select--- O with vertex at
(х, у) %3D
Fill in the following table evaluating y = f(x) at x = 1 and x = 2.
y = f(x)
1
Graph y = f(x) by plotting the vertex and the points from the table, then draw the line through the two points from the
table.
10
Graph Layers
After you add an object to the graph you
elete
can use Graph Layers to view and edit its
properties.
Fill
6
5
4
No
Solution
3
2
e Help
WebAssign. Graphing Tool
Transcribed Image Text:Sketch the function y = x² + 5, and use it as directed below.
(a) Sketch the function and draw the line between the points on the curve at x = 1 and x = 2. What is its slope?
(b) Sketch the function and draw the line between the points on the curve at x = 1 and x = 1.5. What is its
slope?
(c) Sketch the function and draw what you imagine would be the tangent line to the curve at x = 1 (touches the
curve at just that point).
Step 1 of 5
(a) Sketch the function and draw the line between the points on the curve at x = 1 and x = 2. What is its slope?
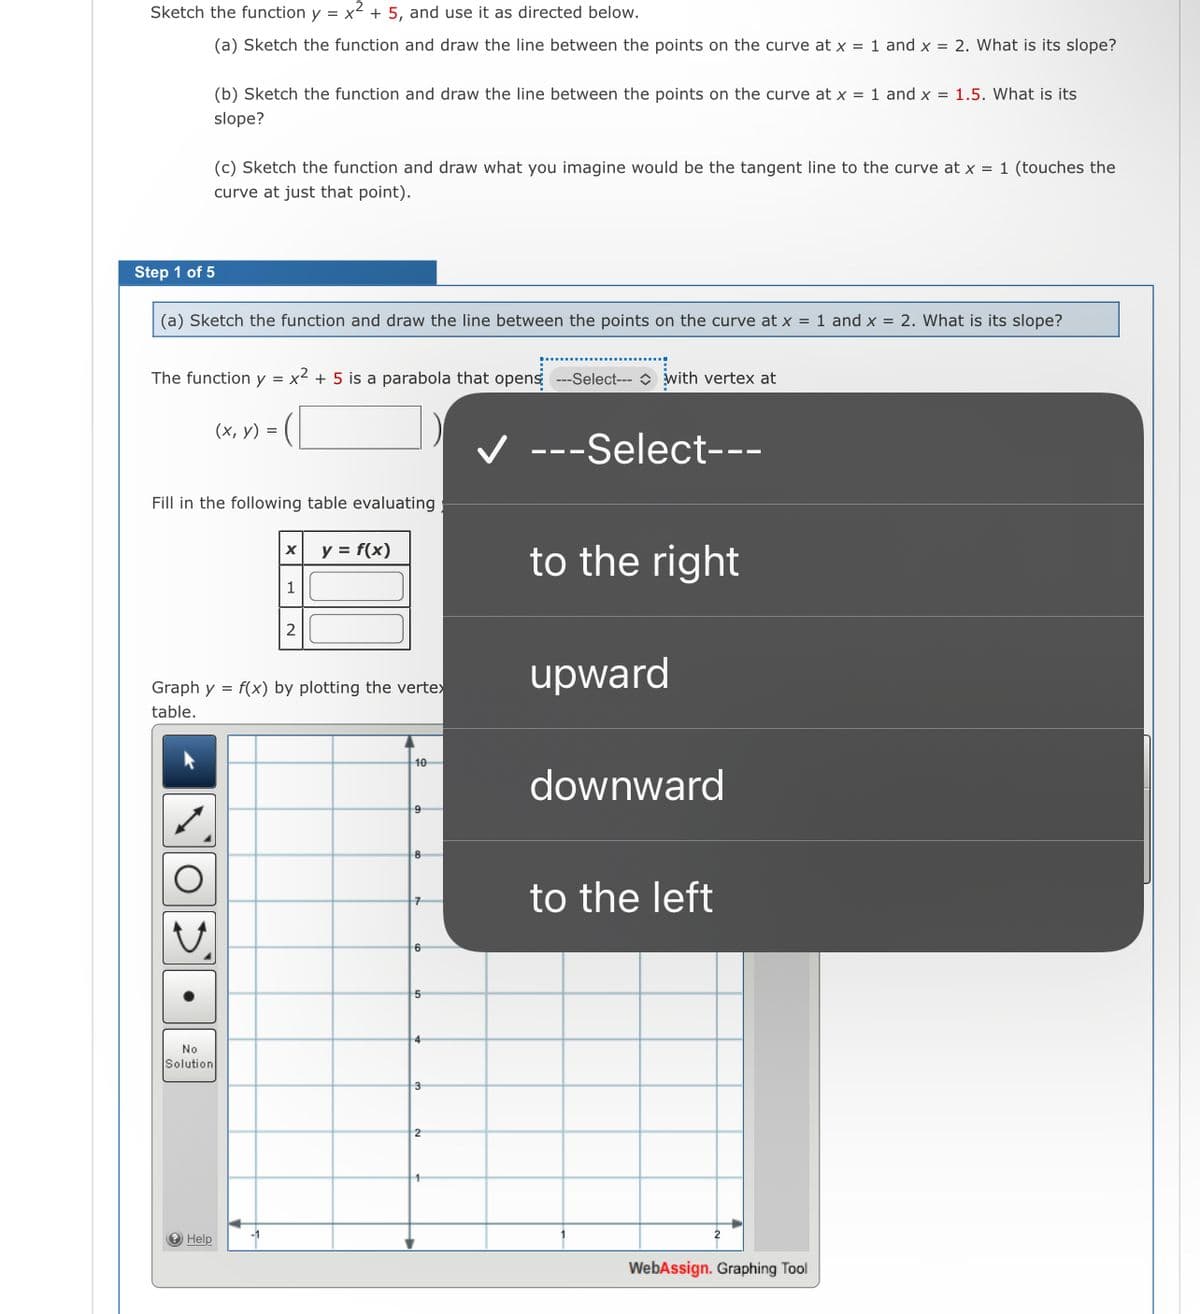
The function y = x2 + 5 is a parabola that opens ---Select--- O with vertex at
(х, у) %3D
V ---Select---
Fill in the following table evaluating
y = f(x)
to the right
1
2
upward
Graph y = f(x) by plotting the vertex
table.
10
downward
8
to the left
6
4
No
Solution
e Help
WebAssign. Graphing Tool
Expert Solution
This question has been solved!
Explore an expertly crafted, step-by-step solution for a thorough understanding of key concepts.

This is a popular solution!

Trending now
This is a popular solution!

Step by step
Solved in 3 steps with 3 images

Recommended textbooks for you
Big Ideas Math A Bridge To Success Algebra 1: Stu…
Algebra
ISBN:
9781680331141
Author:
HOUGHTON MIFFLIN HARCOURT
Publisher:
Houghton Mifflin Harcourt

Algebra & Trigonometry with Analytic Geometry
Algebra
ISBN:
9781133382119
Author:
Swokowski
Publisher:
Cengage

College Algebra
Algebra
ISBN:
9781305115545
Author:
James Stewart, Lothar Redlin, Saleem Watson
Publisher:
Cengage Learning
Big Ideas Math A Bridge To Success Algebra 1: Stu…
Algebra
ISBN:
9781680331141
Author:
HOUGHTON MIFFLIN HARCOURT
Publisher:
Houghton Mifflin Harcourt
Algebra & Trigonometry with Analytic Geometry
Algebra
ISBN:
9781133382119
Author:
Swokowski
Publisher:
Cengage
College Algebra
Algebra
ISBN:
9781305115545
Author:
James Stewart, Lothar Redlin, Saleem Watson
Publisher:
Cengage Learning

Trigonometry (MindTap Course List)
Trigonometry
ISBN:
9781337278461
Author:
Ron Larson
Publisher:
Cengage Learning