
Mathematics For Machine Technology
8th Edition
ISBN:9781337798310
Author:Peterson, John.
Publisher:Peterson, John.
Chapter61: Areas Of Circles, Sectors, And Segments
Section: Chapter Questions
Problem 2A: Find the area of the shaded portion of this figure. Round your answer to 2 decimal places.

Related questions
Question
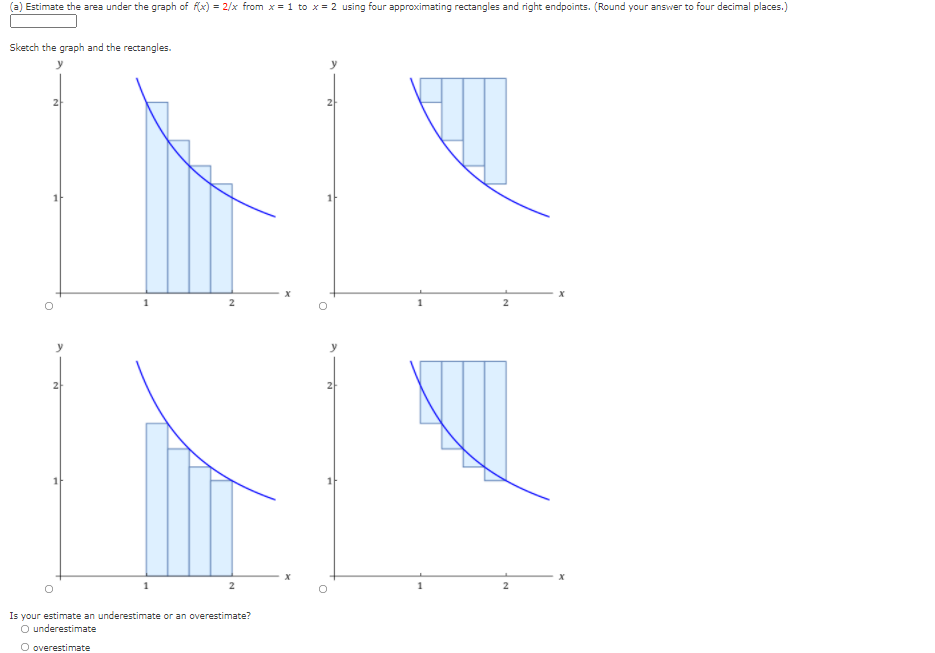
Transcribed Image Text:Estimate the area under the graph of fx) = 2/x from x = 1 to x = 2 using four approximating rectangles and right endpoints. (Round your answer to four decimal places.)
Sketch the graph and the rectangles.
21
y
Is your estimate an underestimate or an overestimate?
O underestimate
O overestimate
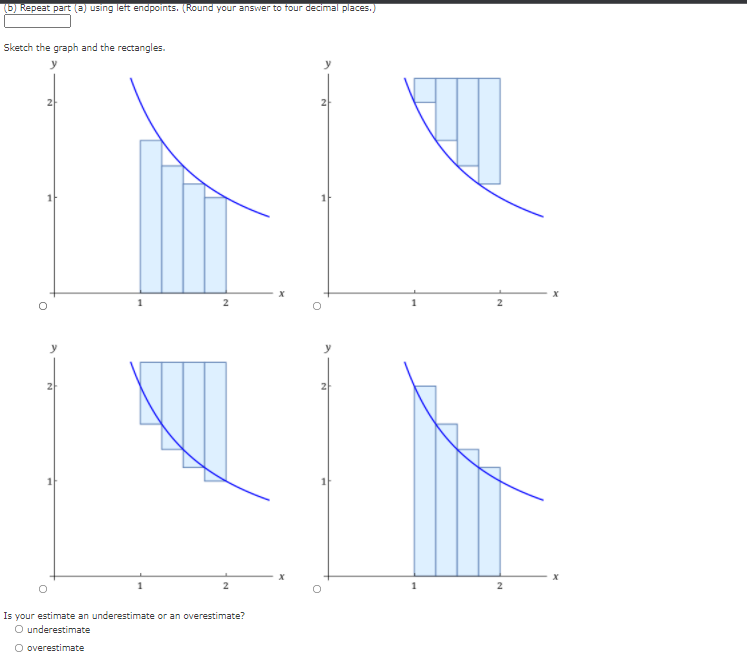
Transcribed Image Text:(b) Repeat part (a) using left endpoints. (Round your answer to four decimal places.)
Sketch the graph and the rectangles.
Is your estimate an underestimate or an overestimate?
O underestimate
O overestimate
21
과
Expert Solution
This question has been solved!
Explore an expertly crafted, step-by-step solution for a thorough understanding of key concepts.

Step by step
Solved in 2 steps with 2 images

Recommended textbooks for you
Mathematics For Machine Technology
Advanced Math
ISBN:
9781337798310
Author:
Peterson, John.
Publisher:
Cengage Learning,
Mathematics For Machine Technology
Advanced Math
ISBN:
9781337798310
Author:
Peterson, John.
Publisher:
Cengage Learning,