Social Survey is an annual survey given to about 1500 U.S. adults selected at random. A recent survey contained the question "How important to your life is having a fulfilling job?" Of the 238 college graduates surveyed, 102 chose the response "Very important." Of the 130 people surveyed whose highest level of education was high school or less, 39 chose the response "Very important." Based on these data, can we conclude, at the 0.05 level of significance, that there is a difference between the proportion p, of all U.S. college graduates who would answer "Very important" and the proportion p₂ of all U.S. adults whose highest level of education was high school or less who would answer "Very important"? Perform a two-tailed test. Then complete the parts below. Carry your intermediate computations to three or more decimal places and round your answers as specified in the parts below. (If necessary, consult a list of formulas.) (a) State the null hypothesis Ho and the alternative hypothesis H₁. HO P Ho :D H₁:0 S (b) Determine the type of test statistic to use. (Choose one) 0-0 050 020 (c) Find the value of the test statistic. (Round to three or more decimal places.) < >0 0 ? (d) Find the p-value. (Round to three or more decimal places.) |x X
Social Survey is an annual survey given to about 1500 U.S. adults selected at random. A recent survey contained the question "How important to your life is having a fulfilling job?" Of the 238 college graduates surveyed, 102 chose the response "Very important." Of the 130 people surveyed whose highest level of education was high school or less, 39 chose the response "Very important." Based on these data, can we conclude, at the 0.05 level of significance, that there is a difference between the proportion p, of all U.S. college graduates who would answer "Very important" and the proportion p₂ of all U.S. adults whose highest level of education was high school or less who would answer "Very important"? Perform a two-tailed test. Then complete the parts below. Carry your intermediate computations to three or more decimal places and round your answers as specified in the parts below. (If necessary, consult a list of formulas.) (a) State the null hypothesis Ho and the alternative hypothesis H₁. HO P Ho :D H₁:0 S (b) Determine the type of test statistic to use. (Choose one) 0-0 050 020 (c) Find the value of the test statistic. (Round to three or more decimal places.) < >0 0 ? (d) Find the p-value. (Round to three or more decimal places.) |x X

Glencoe Algebra 1, Student Edition, 9780079039897, 0079039898, 2018
18th Edition
ISBN:9780079039897
Author:Carter
Publisher:Carter
Chapter10: Statistics
Section10.6: Summarizing Categorical Data
Problem 10CYU

Related questions
Question
Please show step by step
Transcribed Image Text:Español
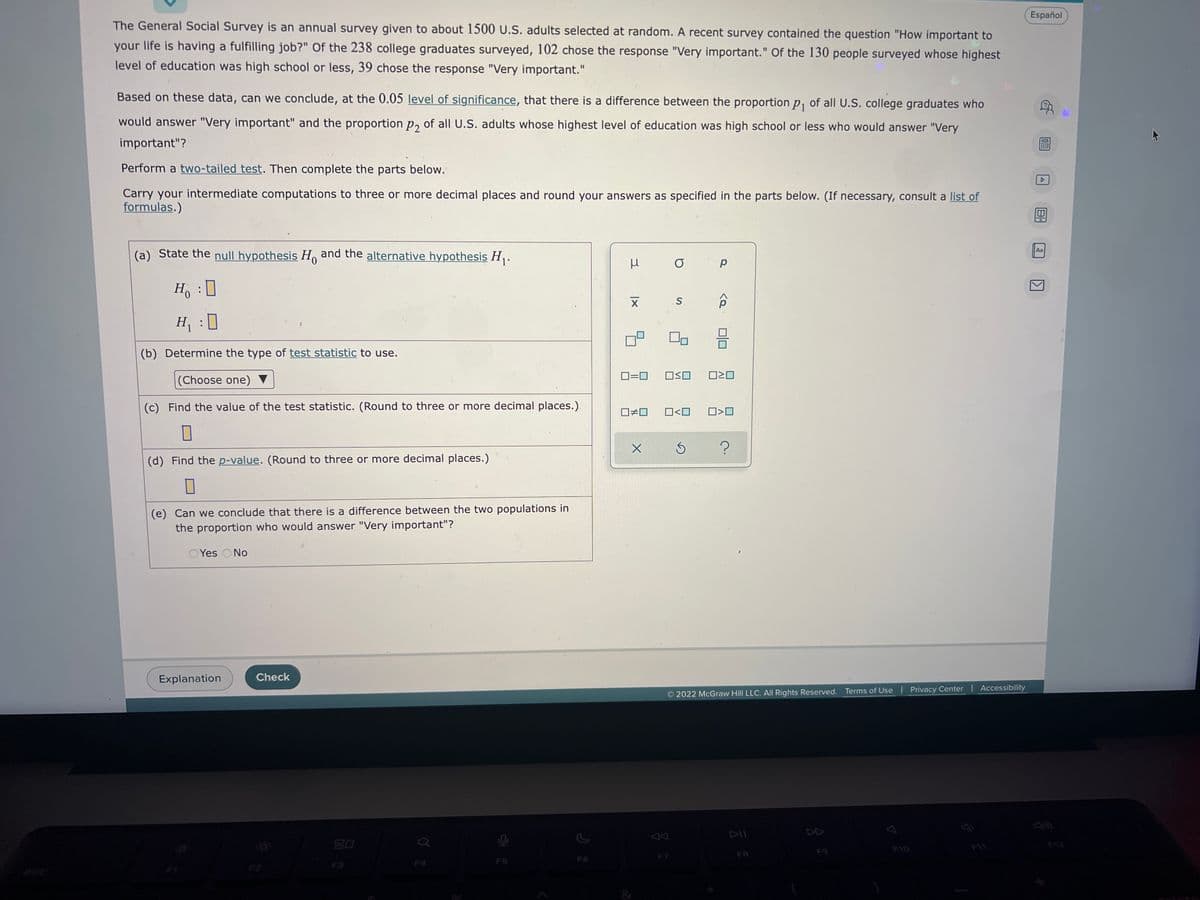
The General Social Survey is an annual survey given to about 1500 U.S. adults selected at random. A recent survey contained the question "How important to
your life is having a fulfilling job?" Of the 238 college graduates surveyed, 102 chose the response "Very important." Of the 130 people surveyed whose highest
level of education was high school or less, 39 chose the response "Very important."
Based on these data, can we conclude, at the 0.05 level of significance, that there is a difference between the proportion p₁ of all U.S. college graduates who
would answer "Very important" and the proportion p₂ of all U.S. adults whose highest level of education was high school or less who would answer "Very
important"?
Perform a two-tailed test. Then complete the parts below.
Carry your intermediate computations to three or more decimal places and round your answers as specified in the parts below. (If necessary, consult a list of
formulas.)
(a) State the null hypothesis Ho and the alternative hypothesis H₁.
Aa
μ
о р
Ho
H₁ :
X
S
(b) Determine the type of test statistic to use.
(Choose one) ▼
0=0
OSO 0²0
(c) Find the value of the test statistic. (Round to three or more decimal places.)
☐☐
0
X
Ś
?
(d) Find the p-value. (Round to three or more decimal places.)
0
(e) Can we conclude that there is a difference between the two populations in
the proportion who would answer "Very important"?
OYes No
2022 McGraw Hill LLC. All Rights Reserved. Terms of Use | Privacy Center | Accessibility
DII
F9
Explanation
Check
30
O<O
<Q
0<0
7
F10
OFF
A
Expert Solution
This question has been solved!
Explore an expertly crafted, step-by-step solution for a thorough understanding of key concepts.

This is a popular solution!

Trending now
This is a popular solution!

Step by step
Solved in 2 steps with 2 images

Recommended textbooks for you
Glencoe Algebra 1, Student Edition, 9780079039897…
Algebra
ISBN:
9780079039897
Author:
Carter
Publisher:
McGraw Hill

Holt Mcdougal Larson Pre-algebra: Student Edition…
Algebra
ISBN:
9780547587776
Author:
HOLT MCDOUGAL
Publisher:
HOLT MCDOUGAL
Glencoe Algebra 1, Student Edition, 9780079039897…
Algebra
ISBN:
9780079039897
Author:
Carter
Publisher:
McGraw Hill
Holt Mcdougal Larson Pre-algebra: Student Edition…
Algebra
ISBN:
9780547587776
Author:
HOLT MCDOUGAL
Publisher:
HOLT MCDOUGAL