Solve 4 and XC

Glencoe Algebra 1, Student Edition, 9780079039897, 0079039898, 2018
18th Edition
ISBN:9780079039897
Author:Carter
Publisher:Carter
Chapter4: Equations Of Linear Functions
Section4.6: Regression And Median-fit Lines
Problem 1AGP

Related questions

Concept explainers
Equations and Inequations
Equations and inequalities describe the relationship between two mathematical expressions.
Linear Functions
A linear function can just be a constant, or it can be the constant multiplied with the variable like x or y. If the variables are of the form, x2, x1/2 or y2 it is not linear. The exponent over the variables should always be 1.
Question
Solve 4 and XC. I attached my answers to the other questions if needed
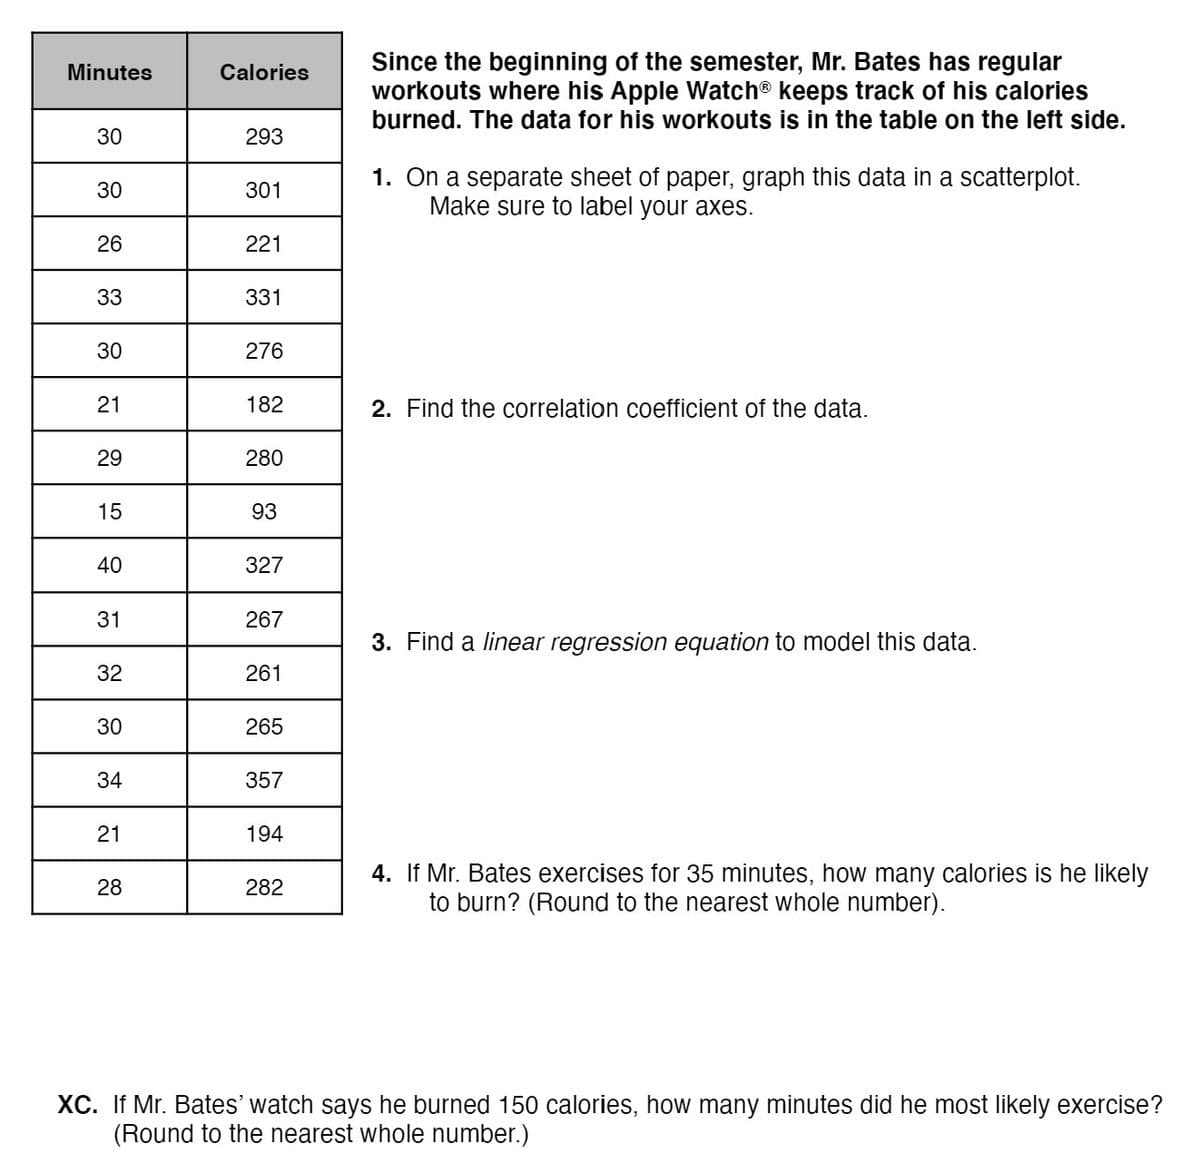
Transcribed Image Text:Since the beginning of the semester, Mr. Bates has regular
workouts where his Apple Watch® keeps track of his calories
burned. The data for his workouts is in the table on the left side.
Minutes
Calories
30
293
1. On a separate sheet of paper, graph this data in a scatterplot.
Make sure to label your axes.
30
301
26
221
33
331
30
276
21
182
2. Find the correlation coefficient of the data.
29
280
15
93
40
327
31
267
3. Find a linear regression equation to model this data.
32
261
30
265
34
357
21
194
4. If Mr. Bates exercises for 35 minutes, how many calories is he likely
to burn? (Round to the nearest whole number).
28
282
XC. If Mr. Bates' watch says he burned 150 calories, how many minutes did he most likely exercise?
(Round to the nearest whole number.)
Transcribed Image Text:301
221
30
900
90601
9030
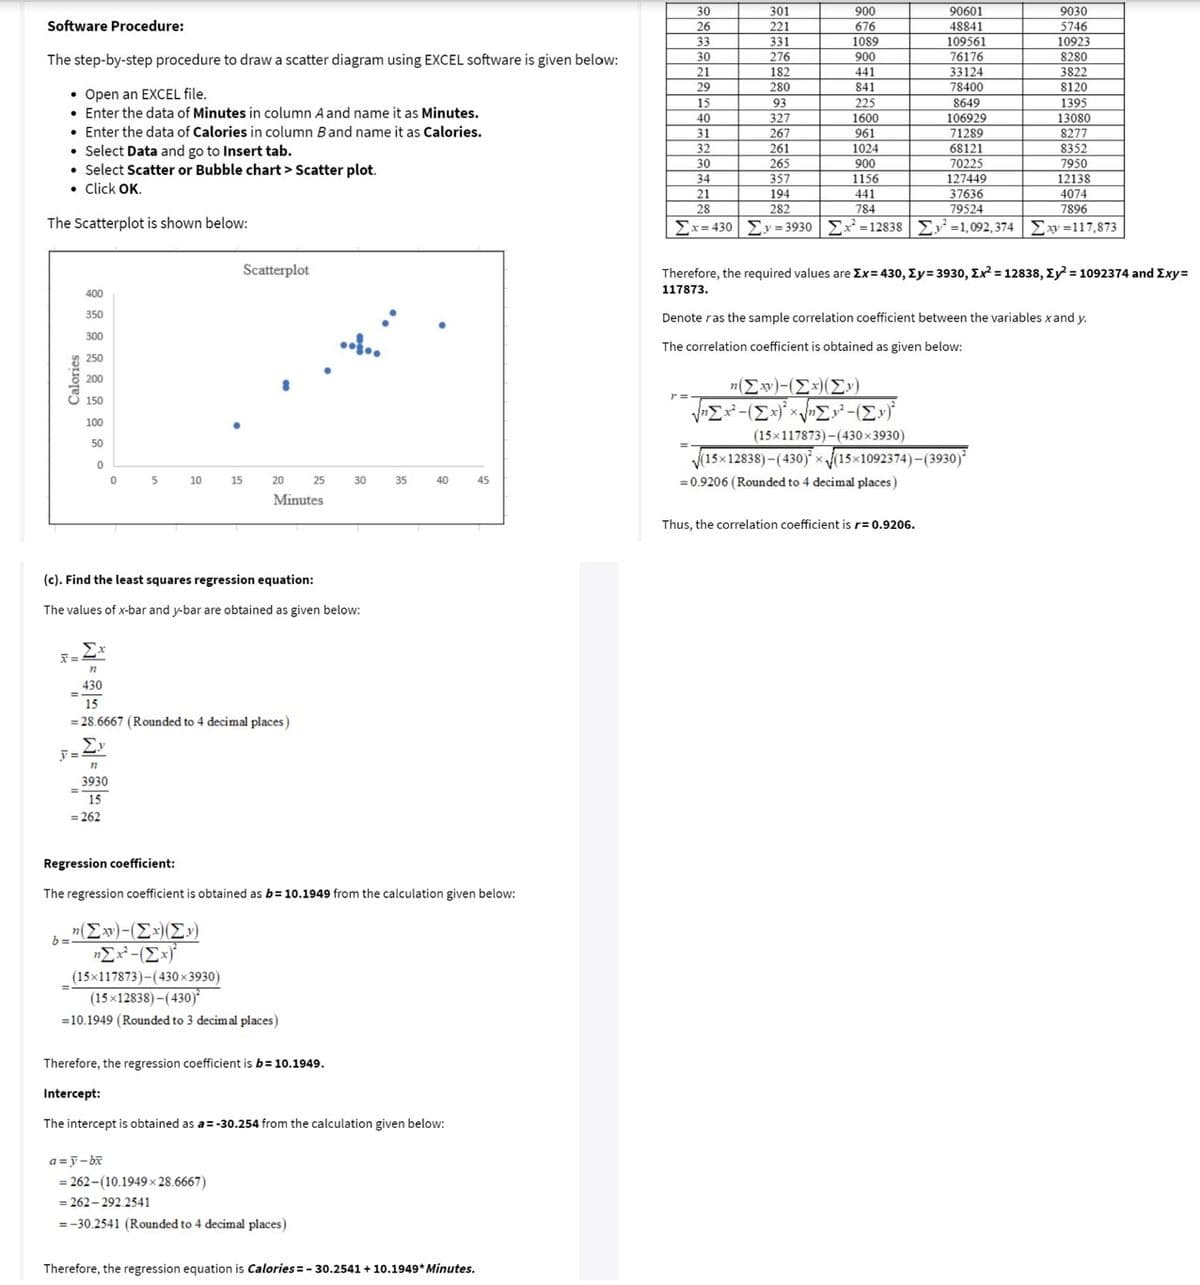
Software Procedure:
26
676
48841
5746
33
331
1089
109561
10923
8280
3822
8120
The step-by-step procedure to draw a scatter diagram using EXCEL software is given below:
30
276
900
76176
33124
78400
21
182
441
280
841
• Open an EXCEL file.
• Enter the data of Minutes in column A and name it as Minutes.
• Enter the data of Calories in column Band name it as Calories.
• Select Data and go to Insert tab.
• Select Scatter or Bubble chart > Scatter plot.
• Click OK.
225
8649
106929
71289
68121
1395
13080
8277
327
1600
267
261
961
1024
8352
7950
70225
127449
37636
79524
y = 3930 Ex = 12838 Ey =1,092,374
30
265
900
1156
441
784
12138
4074
7896
34
357
21
194
28
282
The Scatterplot is shown below:
Σχ-430
Ey =117,873
Scatterplot
Therefore , the required values are Σχ= 430, Σy= 3930, Σχ12838, Σ) = 1092374 and Σxy
400
117873.
350
Denote ras the sample correlation coefficient between the variables xand y.
300
The correlation coefficient is obtained as given below:
250
200
n(Ew)-(Ex)(Ev)
150
100
(15x117873)-(430 x 3930)
50
(15x12838) - (430) x(15x1092374)-(3930)
5
10
15
20
25
30
35
40
45
= 0.9206 (Rounded to 4 decimal places)
Minutes
Thus, the correlation coefficient is r= 0.9206.
(c). Find the least squares regression equation:
The values of x-bar and y-bar are obtained as given below:
Ex
430
15
= 28.6667 (Rounded to 4 decimal places)
Σν
3930
15
= 262
Regression coefficient:
The regression coefficient is obtained as b= 10.1949 from the calculation given below:
(Ew)-(Ex)(E»)
(15x117873)-(430 × 3930)
(15 x12838) -(430)
=10.1949 (Rounded to 3 decimal places)
Therefore, the regression coefficient is b= 10.1949.
Intercept:
The intercept is obtained as a =-30.254 from the calculation given below:
a =j-bx
= 262-(10.1949 x 28.6667)
= 262 - 292.2541
=-30.2541 (Rounded to 4 decimal places)
Therefore, the regression equation is Calories=- 30.2541 + 10.1949* Minutes.
Calories
Expert Solution
Step 1
4.
From part 3, the linear regression equation is .
The number of calories is he likely to burn Mr. Bates exercises for 35 minutes is,
Thus, the number of calories is he likely to burn Mr. Bates exercises for 35 minutes is 327 calories.

Step by step
Solved in 2 steps

Knowledge Booster


Learn more about
Need a deep-dive on the concept behind this application? Look no further. Learn more about this topic, statistics and related others by exploring similar questions and additional content below.Recommended textbooks for you
Glencoe Algebra 1, Student Edition, 9780079039897…
Algebra
ISBN:
9780079039897
Author:
Carter
Publisher:
McGraw Hill

Big Ideas Math A Bridge To Success Algebra 1: Stu…
Algebra
ISBN:
9781680331141
Author:
HOUGHTON MIFFLIN HARCOURT
Publisher:
Houghton Mifflin Harcourt
Glencoe Algebra 1, Student Edition, 9780079039897…
Algebra
ISBN:
9780079039897
Author:
Carter
Publisher:
McGraw Hill
Big Ideas Math A Bridge To Success Algebra 1: Stu…
Algebra
ISBN:
9781680331141
Author:
HOUGHTON MIFFLIN HARCOURT
Publisher:
Houghton Mifflin Harcourt