Solve for B 51, 44 outliers were wrong

Glencoe Algebra 1, Student Edition, 9780079039897, 0079039898, 2018
18th Edition
ISBN:9780079039897
Author:Carter
Publisher:Carter
Chapter10: Statistics
Section10.4: Distributions Of Data
Problem 19PFA

Related questions
Question
Solve for B
51, 44 outliers were wrong
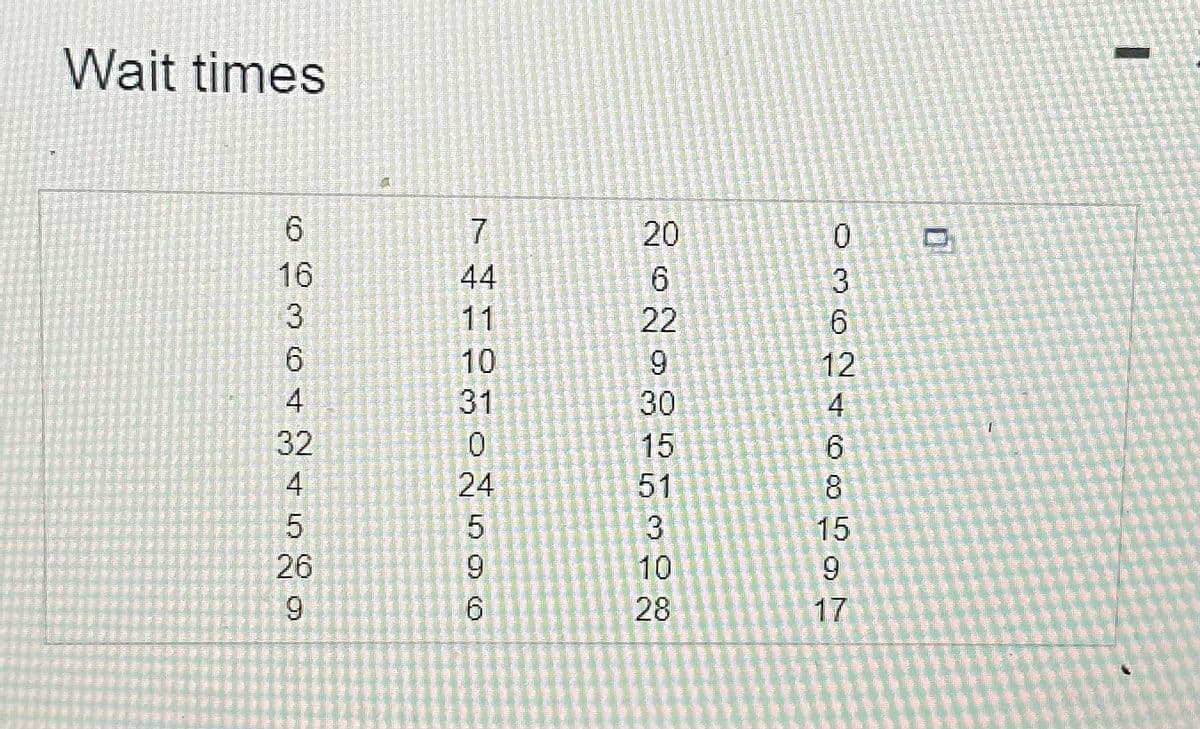
Transcribed Image Text:Wait times
ODGABASCO
16
32
26
TATTOONSOO
7
44
11
10
31
0
24
5
9
6
20
9
22
6
30
15
51
3
10
28
LOGO AÑOWO
12
15
17
0
Transcribed Image Text:▶
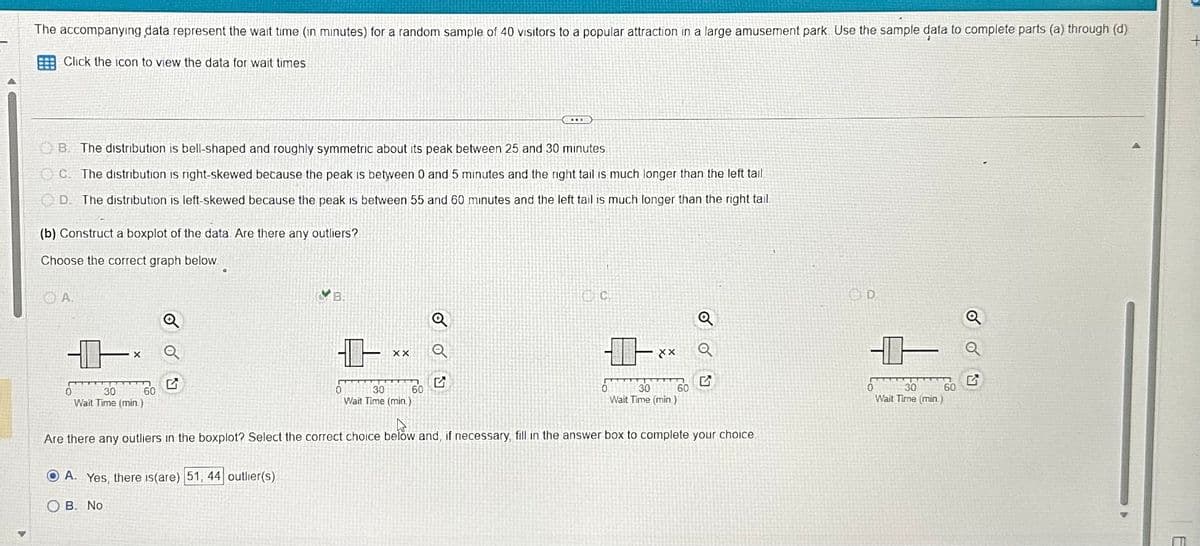
The accompanying data represent the wait time (in minutes) for a random sample of 40 visitors to a popular attraction in a large amusement park. Use the sample data to complete parts (a) through (d)
Click the icon to view the data for wait times.
B. The distribution is bell-shaped and roughly symmetric about its peak between 25 and 30 minutes
OC. The distribution is right-skewed because the peak is between 0 and 5 minutes and the right tail is much longer than the left tail
D. The distribution is left-skewed because the peak is between 55 and 60 minutes and the left tail is much longer than the right tail
(b) Construct a boxplot of the data. Are there any outliers?
Choose the correct graph below
A
X
Q
Q
30
Wait Time (min.)
XX
OA. Yes, there is(are) 51, 44 outler(s)
OB.
No
TE
Q
Q
0
30 60
Wait Time (min.)
C
Ó
30
Wait Time (min)
Are there any outliers in the boxplot? Select the correct choice below and, if necessary, fill in the answer box to complete your choice
XX
Q
Q
60
-10-
0
30
Wait Time (min.)
60
oo
Expert Solution
This question has been solved!
Explore an expertly crafted, step-by-step solution for a thorough understanding of key concepts.

Step by step
Solved in 3 steps with 3 images

Recommended textbooks for you
Glencoe Algebra 1, Student Edition, 9780079039897…
Algebra
ISBN:
9780079039897
Author:
Carter
Publisher:
McGraw Hill

Big Ideas Math A Bridge To Success Algebra 1: Stu…
Algebra
ISBN:
9781680331141
Author:
HOUGHTON MIFFLIN HARCOURT
Publisher:
Houghton Mifflin Harcourt
Glencoe Algebra 1, Student Edition, 9780079039897…
Algebra
ISBN:
9780079039897
Author:
Carter
Publisher:
McGraw Hill
Big Ideas Math A Bridge To Success Algebra 1: Stu…
Algebra
ISBN:
9781680331141
Author:
HOUGHTON MIFFLIN HARCOURT
Publisher:
Houghton Mifflin Harcourt