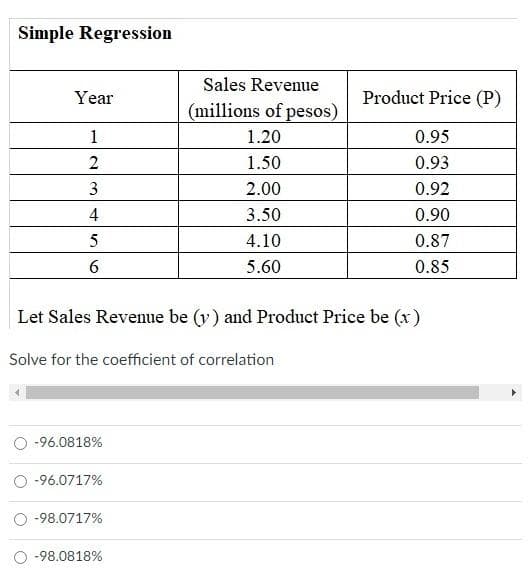
Solve for the coefficient of correlation


Q: Illustration 17.41 A firm produces articles of which 0.1 per cent are usually defective. It packs th...
A:
Q: The figure to the right shows the results of a survey in which 1005 adults from Country A, 1023 adu...
A: From the provided information, Sample size of Country B (n) = 1023 Sample proportion (p̂) = 0.22 Con...
Q: For a distribution Bowley's coefficient of skewness is – 0.56, Q = 16.4 and median = 24.2. What is i...
A: We have given that, Bowley's Coefficient of skewness = -0.56 and Q1 =16.4 and median = 24.2 Then, ...
Q: lustration. 16.82. In a throw of three dice what is the possibility of getting the total 11.
A:
Q: The critical value of t at a given alpha level will be smaller than the comparable critical value of...
A: whether the given statement is true or false
Q: The following are the prices of commodities in 2016 and 2017. Calculate a price index based on price...
A:
Q: Write your solutions Given: I미 = 35 |ANB|= 6 |ANBNC| = 2 |A| = 15 JANC| = 6 |B|= 15 |BNC| = 5 |C| = ...
A: Given problem Given that 4) | A U B' U C' | By using the Venn diagram , Hence The answer ...
Q: Question: A random person gets tested for the disease and the result comes back positive. What is th...
A: Let us define some events A : the person has the disease. B : the person does not have the disease. ...
Q: Calculate the SEMean ii. Construct a 98% confidence interval for the population scores of Mrs. Paul...
A:
Q: The table shows the score obtained by applicants for secretarial position in a certain manufacturing...
A: Solution-: Scores=Class intervals We have following table: Class Interval Frequency (fi) 10--1...
Q: The amount of tea leaves in a can from a particular production line is normally distributed with u =...
A: Let X denote the amount of two leaves. Given that X follows N(mean = 110, SD = 25), then Z = (X - m...
Q: Which of the following is the 8th decile? 91 91.8 94.2 95
A: Data given 91,91.8,94.2,95
Q: The reading speed of second grade students in a large city is approximately normal, with a mean of 9...
A: For the given data Find the probability in part(e )
Q: (Round to four decimal places as needed.) Interpret the probability. Select the correct choice below...
A: We have given that Success of probability p=0.63 Number of trials n=20 We use normal approximations...
Q: Have you ever tried to get out of jury duty? About 25% of those called will find an excuse (work, po...
A: We have given that Success of probability p =0.25 Number of trials n=12 X~binomial ( n ,p)
Q: The amount of time that people spend at Grover Hot Springs is normally dist mean of 70 minutes and a...
A: Note: Please repost part d as I can author only 3 sub-parts as per my policy Given data,Mean μ=70sd ...
Q: Adrian and Casey want to know how much recyclable trash their apartment building generates on a mont...
A: Yes, this situation yields variable data, and therefore, can be written into a statistical question....
Q: A clinical trial was conducted to test the effectiveness of a drug used for treating insomnia in old...
A: Sample size (n) = 14 Sample Standard deviations (s) = 42.9 Degree of freedom (df) = n - 1 = 14 - 1 ...
Q: Two groups of students reported mean weights of 162 kgs and 148 kgs respectively. When would the mea...
A:
Q: experiment. Approximate the mean and standard deviation of the random variable. Compare your is bein...
A: We have given that the probability distribution of the random variable X represents the number of hi...
Q: PVC pipe is manufactured with a mean diameter of 1.01 inch and a standard deviation of 0.003 inch. T...
A:
Q: Nlustration 17.3. The normal rate of infection of a certain dis ease in animals is known to be 40%. ...
A:
Q: A. A balanced coin was tossed thrice. What is the probability of getting at most two tails? B. Is an...
A: Here use basic probability and some basic of mutually exclusive events
Q: The time required for an automotive center to complete an oil change service on an automobile approx...
A:
Q: ane is interested in studying if there is a significant relationship between the severity of COVID 1...
A: Since you have posted a question with multiple sub-parts, we will solve first three subparts for you...
Q: wo professors at a local college developed a new teaching curriculum designed to increase students'...
A: Solution: Given information: p= 0.55 Probability of students complete the course with letter grade ...
Q: Two professors at a local college developed a new teaching curriculum designed to increase students'...
A: Solution-: Given: n=15,x=11,P0=0.55,α=0.1 Sample proportion is, ∴p^=xn=1115=0.7333 (a) State the app...
Q: The average starting salary of students who graduated from colleges of Business in 2009 was $48,400....
A: Solution: Given that: n= 100 Sample size x= $50000 Sample mean μ= $48400 Population mean σ= $8000 ...
Q: The brain volumes (cm) of 20 brains have a mean of 1077.7 cm' and a standard deviation of 12 leviati...
A: Given data,Mean μ=1077.7sd σ=123.1
Q: Suppose the scores of students on an exam are normally distributed with a mean of 276 and a standard...
A: X~N(μ= 276 , σ= 59 ) μ= 276 , σ= 59 Formula for Z-score Z=(X-μ)/σ
Q: One year Todd had the lowest ERA (earned-run average, mean number of runs yielded per nine innings p...
A:
Q: Q1) Below find the records of 12 randomly selected used pickup trucks (none used commercially) and 1...
A: Given that We have to find : (a) Investigate, at the 5% significant level, whether the mean ...
Q: Listed below are speeds (mi/h) measured from traffic on a busy highway. This simple random sample wa...
A: We have given that, The data set are : 60, 64, 64, 56, 64, 52, 59, 58, 59, 68, 62, 66 Then, We wil...
Q: = 1.574 hits (Round to three decimal places as needed.) Compute the theoretical standard deviation o...
A: We have given that the probability distribution of the random variable X represents the number of hi...
Q: Looking at the ABC company Cat Kibbles data set, the quality manager of that company selects and sto...
A:
Q: Anna company sells coffee products to various customers. In recent years, profits have been declinin...
A: Given that the coefficient of determination for marketing expenses is R2= 75% = 0.75 In this case i...
Q: Interpolate the missing figure in the following table with the help of a suitable formula. Year : 19...
A:
Q: writing an appropriate null and alternative hypothesis
A: here use basic of hypothesis testing
Q: Problem 3: Attournamento 0) As a preliminary helper result, show by induction that for events E1, E2...
A: Given information: There is a tournament between N teams, each team playing each of the other teams.
Q: SHS Principal wishes to estimate the average number of hours that Grade 11 students study each week....
A:
Q: Goofy Marketing Solutions conducted a survey among 16 randomly selected visitors to the newly opened...
A:
Q: Fill in the table below (last row is for sums). y ry -9 8 -11 8 -12 Sums Calculate the following by ...
A: We have given that, The data set are: X :- 6, 8, 8 Y :- -9, -11, -12 Then, We will find the ...
Q: You wish to study whether or not a roofer should wear ear protection when using a particular nail gu...
A: The confidence interval is an inference process which gives the range of plausible values of the pop...
Q: Illustration 16.81. Two packs of cards are made up in such a way that the first pack consists of 39 ...
A:
Q: Results Correlation Matrix Correlation Matrix Year Level Stress Year Level Pearson's r p-value Stres...
A: Given:
Q: 8. According to the CDC (2016), the average life expectancy of someone with diabetes is u = 72 %3D y...
A:
Q: The population mean and standard deviation are given below. Find the required probability and determ...
A: Given that, Mean, u= 22 And standard deviation= 1.28 Sample size is n= 70 It is known that, Z sc...
Q: Five sisters named Taylor, Selena, Gigi, Kendall, and Zendaya were born in 1989, 1992, 2003, 2006, a...
A: Five sisters named Taylor, Selena, Gigi, Kendall, and Zendaya were born in 1989, 1992, 2003, 2006, a...
Q: Consider the continuous random variable x, which has a uniform distribution over the interval from 1...
A:
Q: A recent survey of 8 social networking sites has a mean of 13.1 million visitors for a specific mont...
A:
Urgently need

Step by step
Solved in 2 steps with 2 images

- XYZ Corporation Stock Prices The following table shows the average stock price, in dollars, of XYZ Corporation in the given month. Month Stock price January 2011 43.71 February 2011 44.22 March 2011 44.44 April 2011 45.17 May 2011 45.97 a. Find the equation of the regression line. Round the regression coefficients to three decimal places. b. Plot the data points and the regression line. c. Explain in practical terms the meaning of the slope of the regression line. d. Based on the trend of the regression line, what do you predict the stock price to be in January 2012? January 2013?Remainder Round all answers to two decimal places unless otherwise indicated. Gross Domestic Product U.S. gross domestic product, in trillions of dollars, is given in the table below. Date Gross domestic product 2010 15.0 2011 15.5 2012 16.2 2013 16.7 a.Find the equation of the regression line, and explain the meaning of its slope. Round regression line parameters to two decimal places. b.Plot the data points and the regression line. c.When would you predict that a gross domestic product of 17.3 trillion dollars would be reached? The actual gross domestic product in 2014 was 17.3 trillion dollars. What does that say about your prediction?Life Expectancy The following table shows the average life expectancy, in years, of a child born in the given year42 Life expectancy 2005 77.6 2007 78.1 2009 78.5 2011 78.7 2013 78.8 a. Find the equation of the regression line, and explain the meaning of its slope. b. Plot the data points and the regression line. c. Explain in practical terms the meaning of the slope of the regression line. d. Based on the trend of the regression line, what do you predict as the life expectancy of a child born in 2019? e. Based on the trend of the regression line, what do you predict as the life expectancy of a child born in 1580?2300
- Noise and Intelligibility Audiologists study the intelligibility of spoken sentences under different noise levels. Intelligibility, the MRT score, is measured as the percent of a spoken sentence that the listener can decipher at a cesl4ain noise level in decibels (dB). The table shows the results of one such test. (a) Make a scatter plot of the data. (b) Find and graph the regression line. (c) Find the correlation coefficient. Is a linear model appropriate? (d) Use the linear model in put (b) to estimate the intelligibility of a sentence at a 94-dB noise level.Zipfs Law The following table shows U.S cities by rank in terms of population and population in thousands. City Rank r Population N New York 1 8491 Chicago 3 2722 Philadelphia 5 1560 Dallas 9 1280 Austin 11 913 San Francisco 13 852 Columbus 15 836 A rule known as Zipfs law tells us that it is reasonable to approximate these data with a power function. a Use power regression to express the population as a function of the rank. b Plot the data along with the power function from part a. c Phoenix is the sixth largest city in the United States. Use your answer from part a to estimate population of Phoenix. Round your answer in thousands to the nearest whole number. Note: The actual population is 1537 thousand.Olympic Pole Vault The graph in Figure 7 indicates that in recent years the winning Olympic men’s pole vault height has fallen below the value predicted by the regression line in Example 2. This might have occurred because when the pole vault was a new event there was much room for improvement in vaulters’ performances, whereas now even the best training can produce only incremental advances. Let’s see whether concentrating on more recent results gives a better predictor of future records. (a) Use the data in Table 2 (page 176) to complete the table of winning pole vault heights shown in the margin. (Note that we are using x=0 to correspond to the year 1972, where this restricted data set begins.) (b) Find the regression line for the data in part ‚(a). (c) Plot the data and the regression line on the same axes. Does the regression line seem to provide a good model for the data? (d) What does the regression line predict as the winning pole vault height for the 2012 Olympics? Compare this predicted value to the actual 2012 winning height of 5.97 m, as described on page 177. Has this new regression line provided a better prediction than the line in Example 2?


