Solve for the range, variance, and standard deviation of this data: 40, 34, 50, 46, 47, 39. +Input the values of (x- mean) and (x- mean)? on the table (x- mean) (x- mean)? Score (X) 40 34 50 46 47 39
Solve for the range, variance, and standard deviation of this data: 40, 34, 50, 46, 47, 39. +Input the values of (x- mean) and (x- mean)? on the table (x- mean) (x- mean)? Score (X) 40 34 50 46 47 39

Glencoe Algebra 1, Student Edition, 9780079039897, 0079039898, 2018
18th Edition
ISBN:9780079039897
Author:Carter
Publisher:Carter
Chapter10: Statistics
Section10.5: Comparing Sets Of Data
Problem 12PPS

Related questions
Question
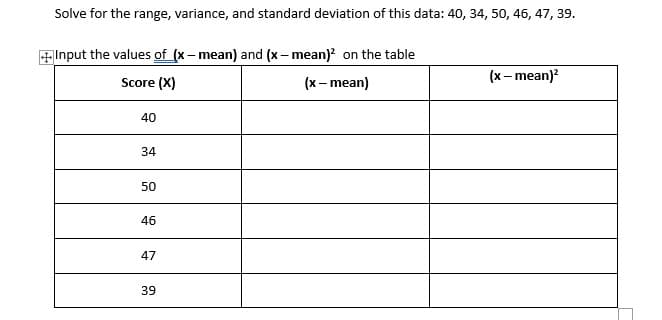
Transcribed Image Text:Solve for the range, variance, and standard deviation of this data: 40, 34, 50, 46, 47, 39.
+Input the values of (x- mean) and (x – mean)? on the table
(x- mean)?
Score (X)
(x- mean)
40
34
50
46
47
39
Expert Solution
This question has been solved!
Explore an expertly crafted, step-by-step solution for a thorough understanding of key concepts.

This is a popular solution!

Trending now
This is a popular solution!

Step by step
Solved in 2 steps with 1 images

Recommended textbooks for you
Glencoe Algebra 1, Student Edition, 9780079039897…
Algebra
ISBN:
9780079039897
Author:
Carter
Publisher:
McGraw Hill
Glencoe Algebra 1, Student Edition, 9780079039897…
Algebra
ISBN:
9780079039897
Author:
Carter
Publisher:
McGraw Hill