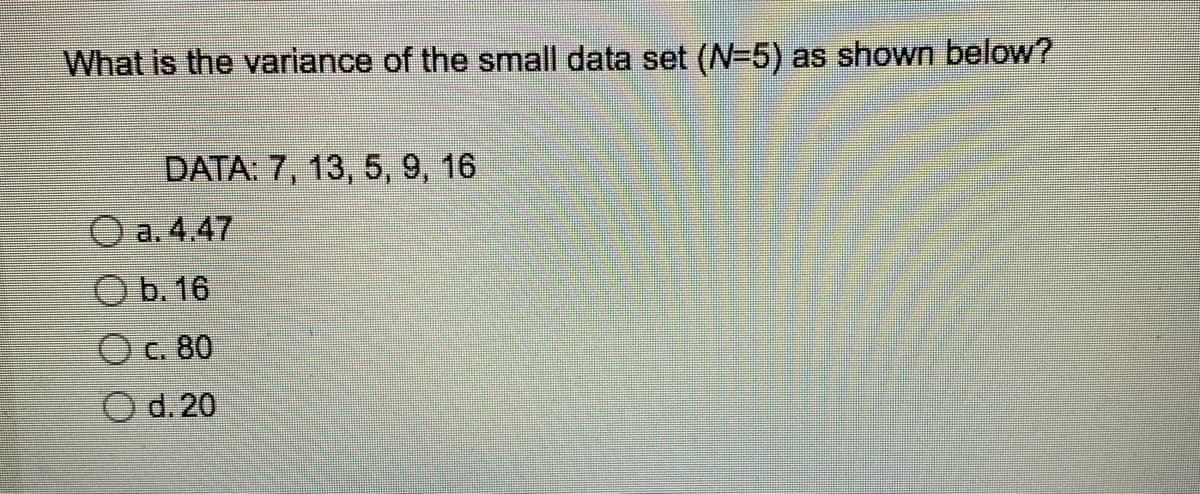
What is the variance of the small DATA: 7, 13, 5, 9, 16 a. 4.47


Q: Step-by-step software procedure for summary in MINITAB software is as follows: • Choose Stat >>…
A: The data is as follows: Los angeles office rental rates Dallas office rental rates 51 18 47…
Q: ou wish to test the following claim (Ha) at a significance level of α=0.005. For the context of this…
A: Given Information: Null Hypothesis H0:μd=0 Alternative Hypothesis Ha:μd>0 Sample size n=117…
Q: A left-tailed z-test found a test statistic of z = -1.99. At a 5% level of significance, what would…
A: Hypothesis test has two statements. They are null and alternate hypothesis. Null hypothesis explain…
Q: 5,000 12,000 17,000 212 300 512
A: Given as,
Q: Suppose that one in six smartphone users have fallen prey to cyber-attack. We use a sample of 159…
A: Given1 in 6 smartphone users have fallen prey to cyber-attacksample size(n)=159
Q: Prevalence of a disease in a certain population is 5.0 / 1000. If one million people live in that…
A:
Q: Use the following information to answer the following question. A bag contains 12 red marbles, 15…
A: Given info: A bag contains 12 red marbles, 15 yellow marbles, 10 green marbles, and 3 black marbles.…
Q: In 2014, the Centers for Disease Control and Prevention reported the percentage of people 18 of age…
A: Given P=0.30 Margin of error =0.02 Confidence level 95%
Q: In a test of the effectiveness of garlic for lowering cholesterol, 47 subjects were treated with…
A:
Q: Years <50 50-54 55-59 60-64 65-69 70+ Africans Population 8,236,458 834,541 757,364 661,428 485,851…
A: Death rate explains the death occurred in the population. Crude death rate explain the over all the…
Q: A state-by-state survey found that the proportions of adults who are smokers in state A and state B…
A: Consider p1 as the proportion of adults who are smokers in state A and p2 as the proportion of…
Q: In one sample, we have n1=200n1=200 and p^1=0.25p^1=0.25. In a second sample, we have n2=100n2=100…
A: Givenn1=200 p^1=0.25 n2=100 p^2=0.75 99% confidence interval
Q: When conducting an ANOVA on sbp and genhelth, the p-value is 0.008. Therefore we conclude Group of…
A: Given: When conducting an ANOVA on sbp and genhelth, the p-value is 0.008.
Q: A humane society claims that less than 73% of households in a certain country own a pet. In a…
A: A random sample of 700 households in that country, 490 say they own a pet. n=700 x=490 α=0.01
Q: In a simple random sample of 1200 Americans age 20 and over, 138 of them were fou to have Type I…
A: Hey there! Thank you for posting the question. Since there are multiple questions posted, we will…
Q: Let X₁, X₂,...,Xn be a random sample of size, n from a normal distribution with mean, and variance,…
A:
Q: Suppose x has a distribution with a mean of 30 and a standard deviation of 4. Random samples of size…
A: We have given that x has a distribution with a mean of 30 and a standard deviation of 4. μ=30σ=4 The…
Q: Calculate Q1, Q2, Q3, D1, D4, D5, D7, P10, P25, P50 and P70 for the following IQ scores: 87 90 95 96…
A: The total observation (score) present here is 23. Therefore, the size N is 23. The given…
Q: ence rate of tub
A: Given, Number of individual cases= 17,357 Estimated population= 275,326,000
Q: Lombard Electronics Company has just installed a new machine that makes a part that is used in…
A:
Q: At one college, GPA's have a distribution that is unimodal and symmetric with a mean of 2.6 and a…
A: Given Mean= 2.6 Standard deviation=0.5
Q: 8. The lengths of bolts produced in a certain factory may be taken to be normally distributed. The…
A:
Q: School of Computing did a survey on the IQ and the score in a Database test of a sample of 10…
A: Given data: Student IQ(x) Database Score(y) A 110 26 B 107 31 C 127 37 D 100 20 E 132…
Q: Carry out the steps of hypothesis testing for a paired sample t-test with a 0.05 level of…
A: let, μ1 : mean of before workshopμ2 : mean of after workshop x : sample mean of the…
Q: 5. Using the same calculator find the value of Zo such that the following is true: ii) P(Z<ZO)=0.15…
A: According to the given information in this question We need to find the P( Z≤ Z0) = 0.15
Q: Find the area of the shaded region. The graph depicts the standard normal distribution with mean 0…
A: According to the given information in this question We need to find the area of the shaded region
Q: A card is drawn at random from a deck of 52 playing cards. Find the probability of the card drawing…
A:
Q: A clinical trial was conducted to test the effectiveness of a drug used for treating insomnia in…
A: Given n be total subject. n=16 and mean=91.6 min and s=standard deviation=40.1 min Find the 95%…
Q: tervals based on one hundred how m ndom Samples of Size n vals Would you expect to i Unknown…
A: Given: 95 % confidence interval To find the interval to include unknown parameter.
Q: You are testing the claim that the mean GPA of night students is different than the mean GPA of day…
A: According to the given information in this question We need to find the value of test statistic
Q: Why is the expected value 50.50? When you've said it should be 100/2 in the explanation?
A: GivenA fair 100 sided dice is rolled where each outcome has equal probability =1100The expected…
Q: 12) The distributions of income in the United States is strongly skewed to the right. Which of the…
A:
Q: CLT
A: Given: Population = Lizards Population mean = μ = 3.1 Population Standard Deviation = σ = 0.8 Sample…
Q: Which distribution should you use? You are approximating the proportion of the population in…
A: Sometimes observation are taken on qualitative characteristics. In this case number of observations…
Q: Use the following frequency distribution table to find the value of the mean score. Scores Frequency…
A: Given frequency distribution table; Scores Frequency(n) mid-point(x) n.x 1-5 3 3 9 6-10 6 8…
Q: The following data were obtained from an independent-measures study comparing the trainees’ test…
A: The question is about one way - ANOVA Given :
Q: The mean and the standard deviation of a normal population are 11,795 and 14054 respectively. If n=…
A:
Q: 83 76 94 88 X: Midterm scores Y: Final scores a. What is the value of the correlation coefficient?…
A: Answer: a)Answer: Correlation coefficient =r=∑XY-nXY∑X2-nX2 ×∑Y2-nY2 Calculation table: X Y X^2…
Q: Below is the standard deviation for extreme 10k finish times for a randomly selected group of women…
A: Given: The standard deviation for extreme 10k finish times for a randomly selected group of women is…
Q: Find the least square polynomial approximation of degree two to the data. 0 -4 Let y = a + bx + cx².…
A: Note that I used R software for my calculations. Regression analysis
Q: Please use the accompanying Excel data set or accompanying Text file data set when completing the…
A: Sample size n = 7 Formula Used: Test-statistic t = dsdn Confidence interval = d ± t*sdn
Q: If the correlation between x and y is r=0.58, which one of the following statements is true? O High…
A: A correlation coefficient explains the link between two factors. It does not show a causal…
Q: A consulting company would like to evaluate four different methods for training its employees to do…
A: Introduction: Denote μ1, μ2, μ3, μ4 as the true mean performance marks obtained by employees…
Q: a) Find a 95% confidence interval estimate for the true mean gaming hours during the week for gaming…
A: Here n=22 , X~Nμ,σ2 mean x=16.3 standard deviation s=5.3
Q: a) Carry out a t-test using five steps of hypothesis testing with the 0.05 level of significance at…
A:
Q: How about question ii?
A: Given Total number of people =300 Total number of married couple =150 Total number of people in a…
Q: a) Estimate the degree of freedom for the above scenario.
A:
Q: ОВ. НЕ H₁: F
A: we have given data of simple random sample of front-seat occupants involved in car crashes n1=2806…
Q: What conditions are necessary in order to use a t-test to test the differences between two…
A: The objective is to identify the conditions that are necessary to use a t-test to test the…
Q: Claudia's bakery business has taken off. Her goods are so popular that she has decided to invest in…
A: Solution: Given information: n= 10 Sample size s2= 0.13 Sample variance σ2= 0.27 Population…

Step by step
Solved in 2 steps
