solve the application problem . if no interest rate is given assume 3 1/2 % interest compounded daily. On Oct 1, The Bakery opened a savings account with deposit of 17,600 . A withdrawl of 7500 was made 15 days later and another withdrawal of 400 was made 8 days before January 1 . Find the balance on January 1
solve the application problem . if no interest rate is given assume 3 1/2 % interest compounded daily. On Oct 1, The Bakery opened a savings account with deposit of 17,600 . A withdrawl of 7500 was made 15 days later and another withdrawal of 400 was made 8 days before January 1 . Find the balance on January 1

Algebra & Trigonometry with Analytic Geometry
13th Edition
ISBN:9781133382119
Author:Swokowski
Publisher:Swokowski
Chapter10: Sequences, Series, And Probability
Section10.1: Infinite Sequences And Summation Notation
Problem 72E

Related questions
Question
solve the application problem . if no interest rate is given assume 3 1/2 % interest compounded daily. On Oct 1, The Bakery opened a savings account with deposit of 17,600 . A withdrawl of 7500 was made 15 days later and another withdrawal of 400 was made 8 days before January 1 . Find the balance on January 1
Transcribed Image Text:Number
of Days
Value
Valee
Valne
Valee
Vale
of
of
of
of
(1+
(1+ i
(1+1Y
(1+0
1.005260
(1+
1007024219
1.000095890
19
1.001821
37
55
73
1000191790
1001919556
20
21
22
23
24
25
26
27
28
29
30
38
39
56
74
57
LIIS 54
25
4
100 17
L00211714
1002TH
40
58
10
42
43
41
77
100067540
1.00067146
60
1.00 21
10026141
L02271
LO 42
1007
61
44
45
10
10
1000918
1,00108300
L001151292
13
100
100451
47
1002MI
LANSI
83
12
1000716
100
100124729
31
49
1007o
100 e
51
14
1001343300
32
15
LO014322
33
16
34
70
17
35
53
71
18
L001727435
36
54
Note The vala ol (1+r conpondd dai anar wi di d eeid dmis L NcER
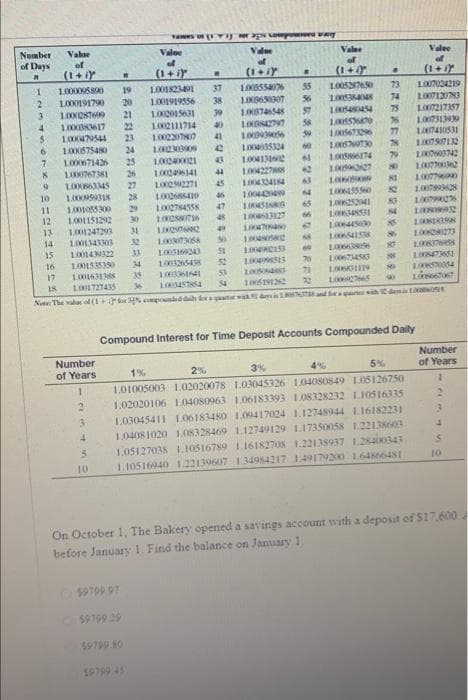
Compound Interest for Time Deposit Accounts Compounded Daily
Number
of Years
Number
of Years
1%
2%
3%
4%
1,01005003 1.02020078 1.03045326 1.04OS0849 1.05126750
1.02020106 1.04080963 1.06183393 1.08328232 L10516335
1.
3.
1.03045411 1L.06183480 1.09417024 1.12748944 L.16182231
1.04081020 1.08328469 1.12749129 1.17350058 1.2213s603
1.05127038 1.10516789 1.16182708 1.22138937 128400343
3.
10
1.10516940 1.22139607 134984217 149179200 164866481
10
On October 1, The Bakery opened a savings account with a deposit of $17,600.
before January 1. Find the balance on January 1.
$9799 07
59799 29
59799 80
SP799 45
Expert Solution
This question has been solved!
Explore an expertly crafted, step-by-step solution for a thorough understanding of key concepts.

Step by step
Solved in 2 steps

Recommended textbooks for you
Algebra & Trigonometry with Analytic Geometry
Algebra
ISBN:
9781133382119
Author:
Swokowski
Publisher:
Cengage
Algebra & Trigonometry with Analytic Geometry
Algebra
ISBN:
9781133382119
Author:
Swokowski
Publisher:
Cengage